Metrics Overview
Metrics help you understand how your app is performing for your users. It helps you answer questions like:
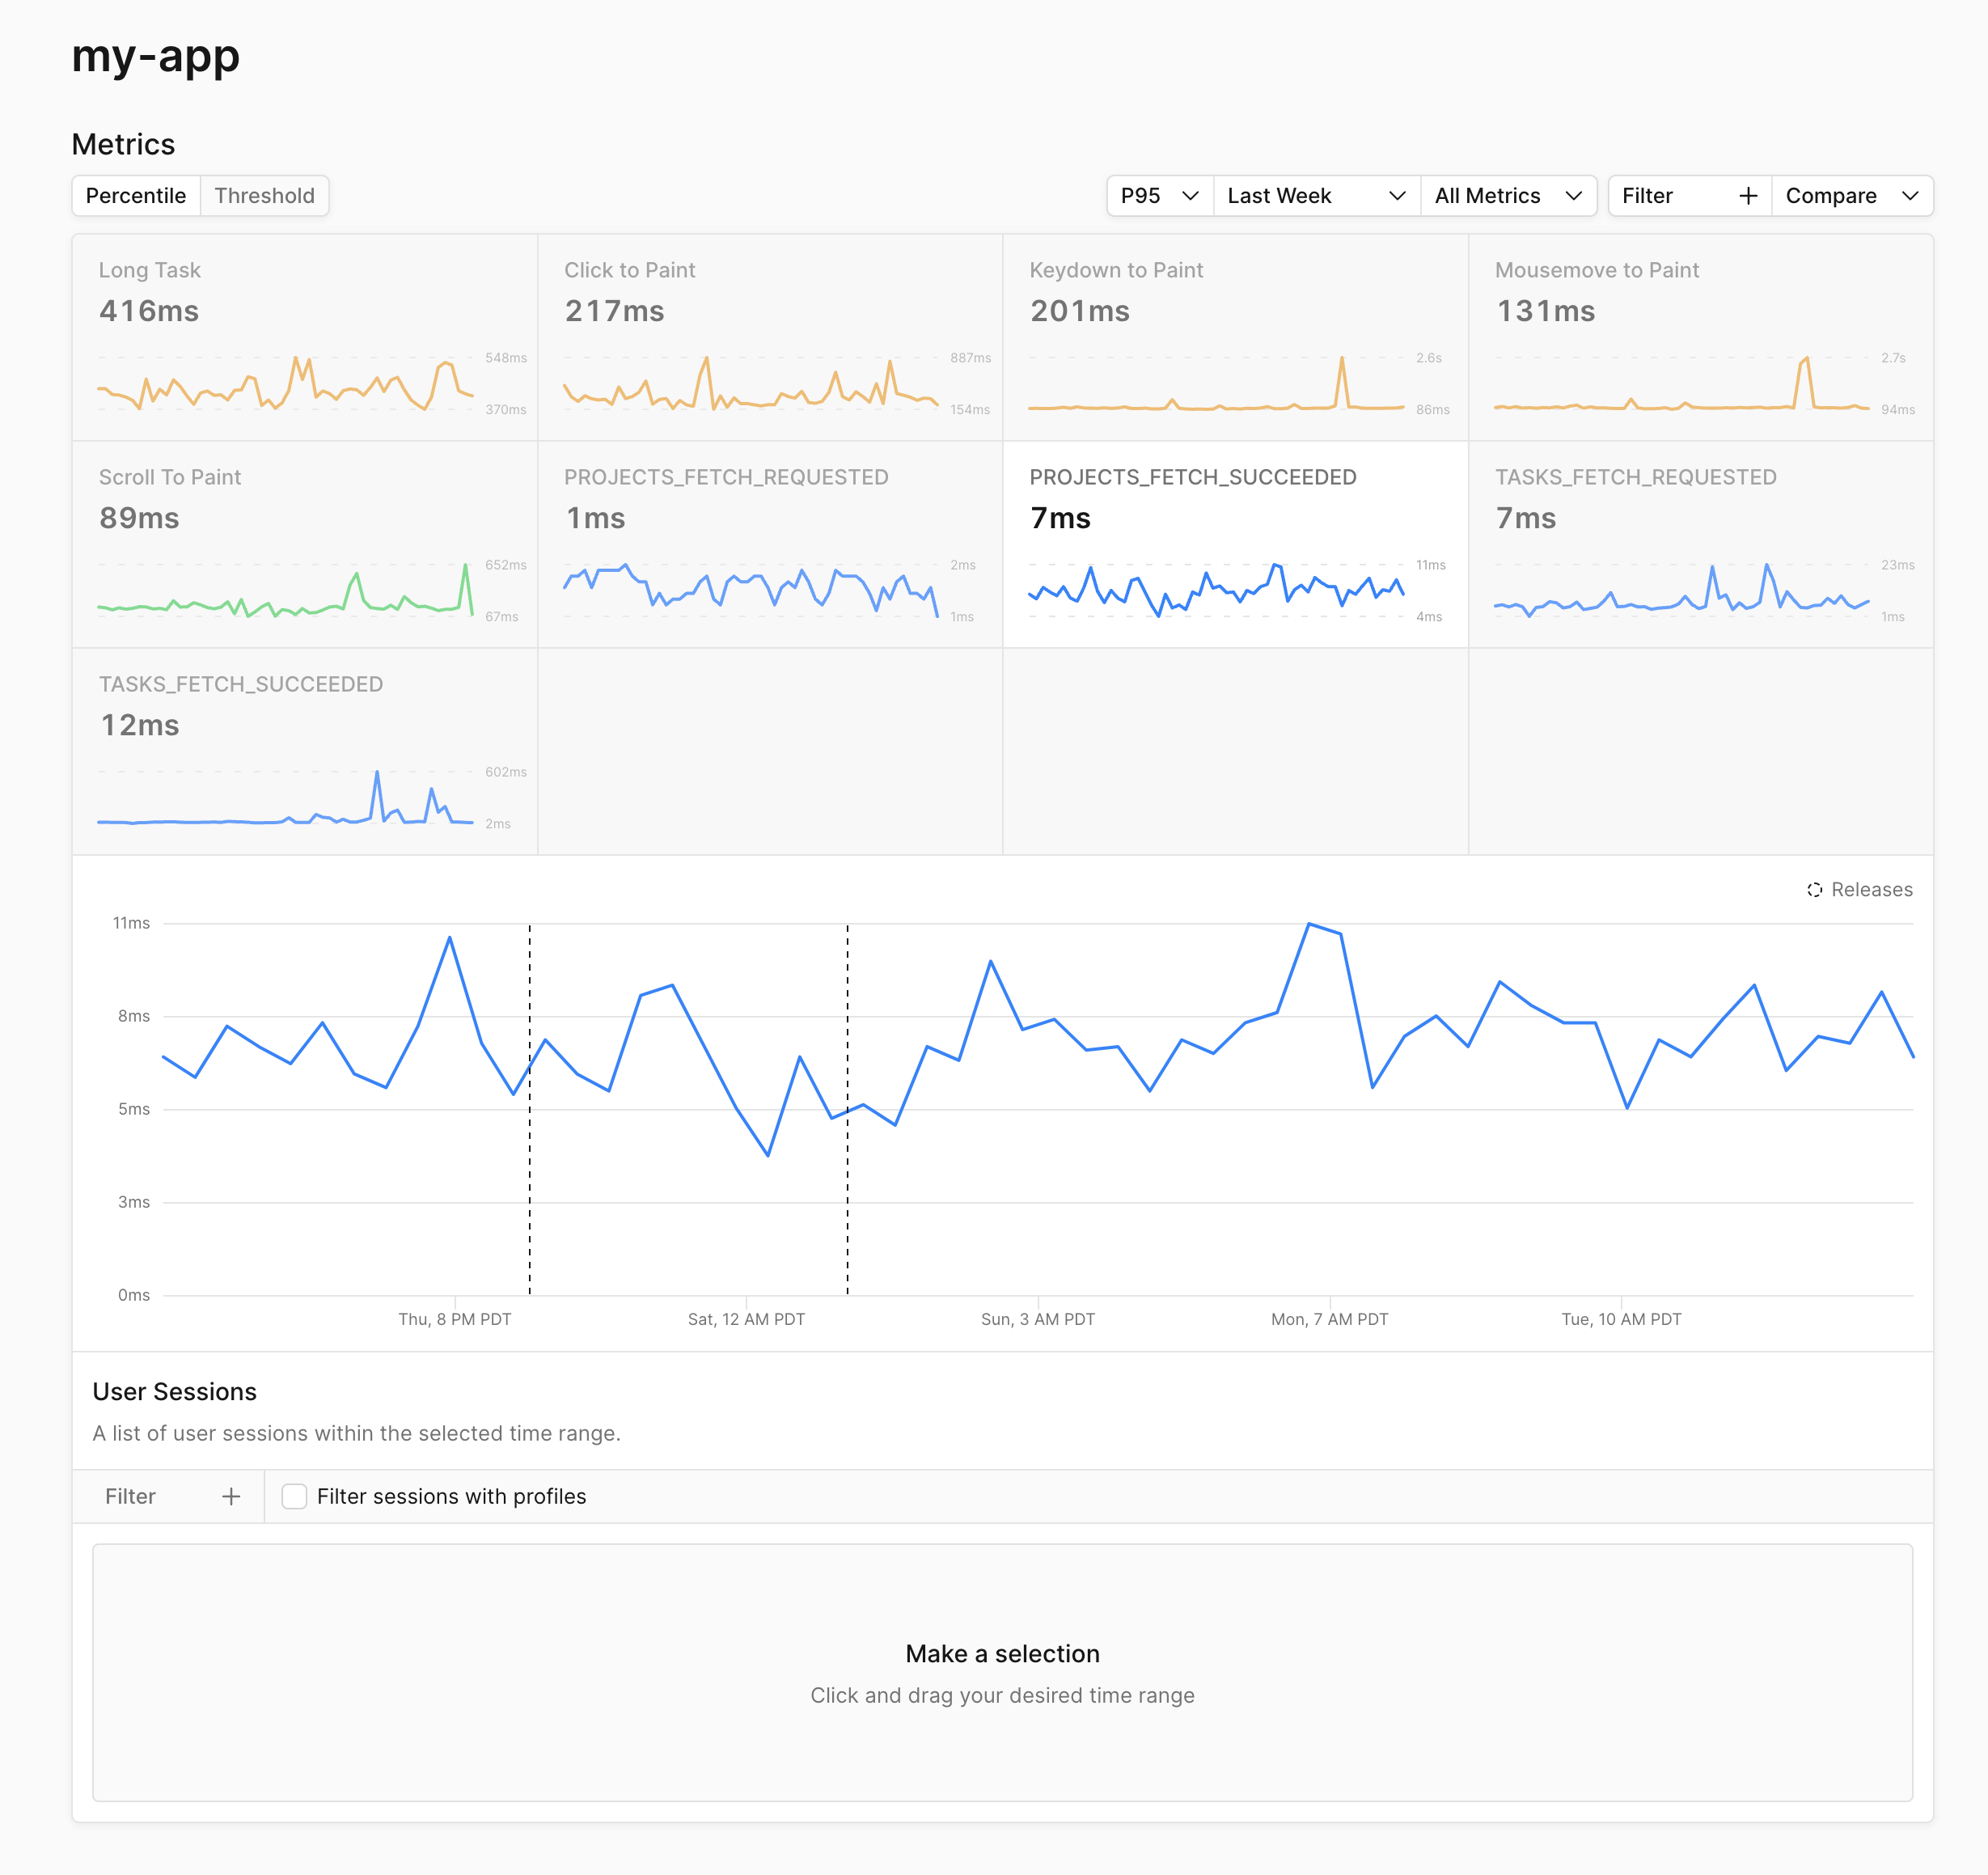
- How does the p95 of click responsiveness compare between all versions of your app?
- How does the p90 of keypress responsiveness compare between mobile and desktop?
- How does the p80 of FCP compare between countries on version
v1.3.4and on path/dashboard?
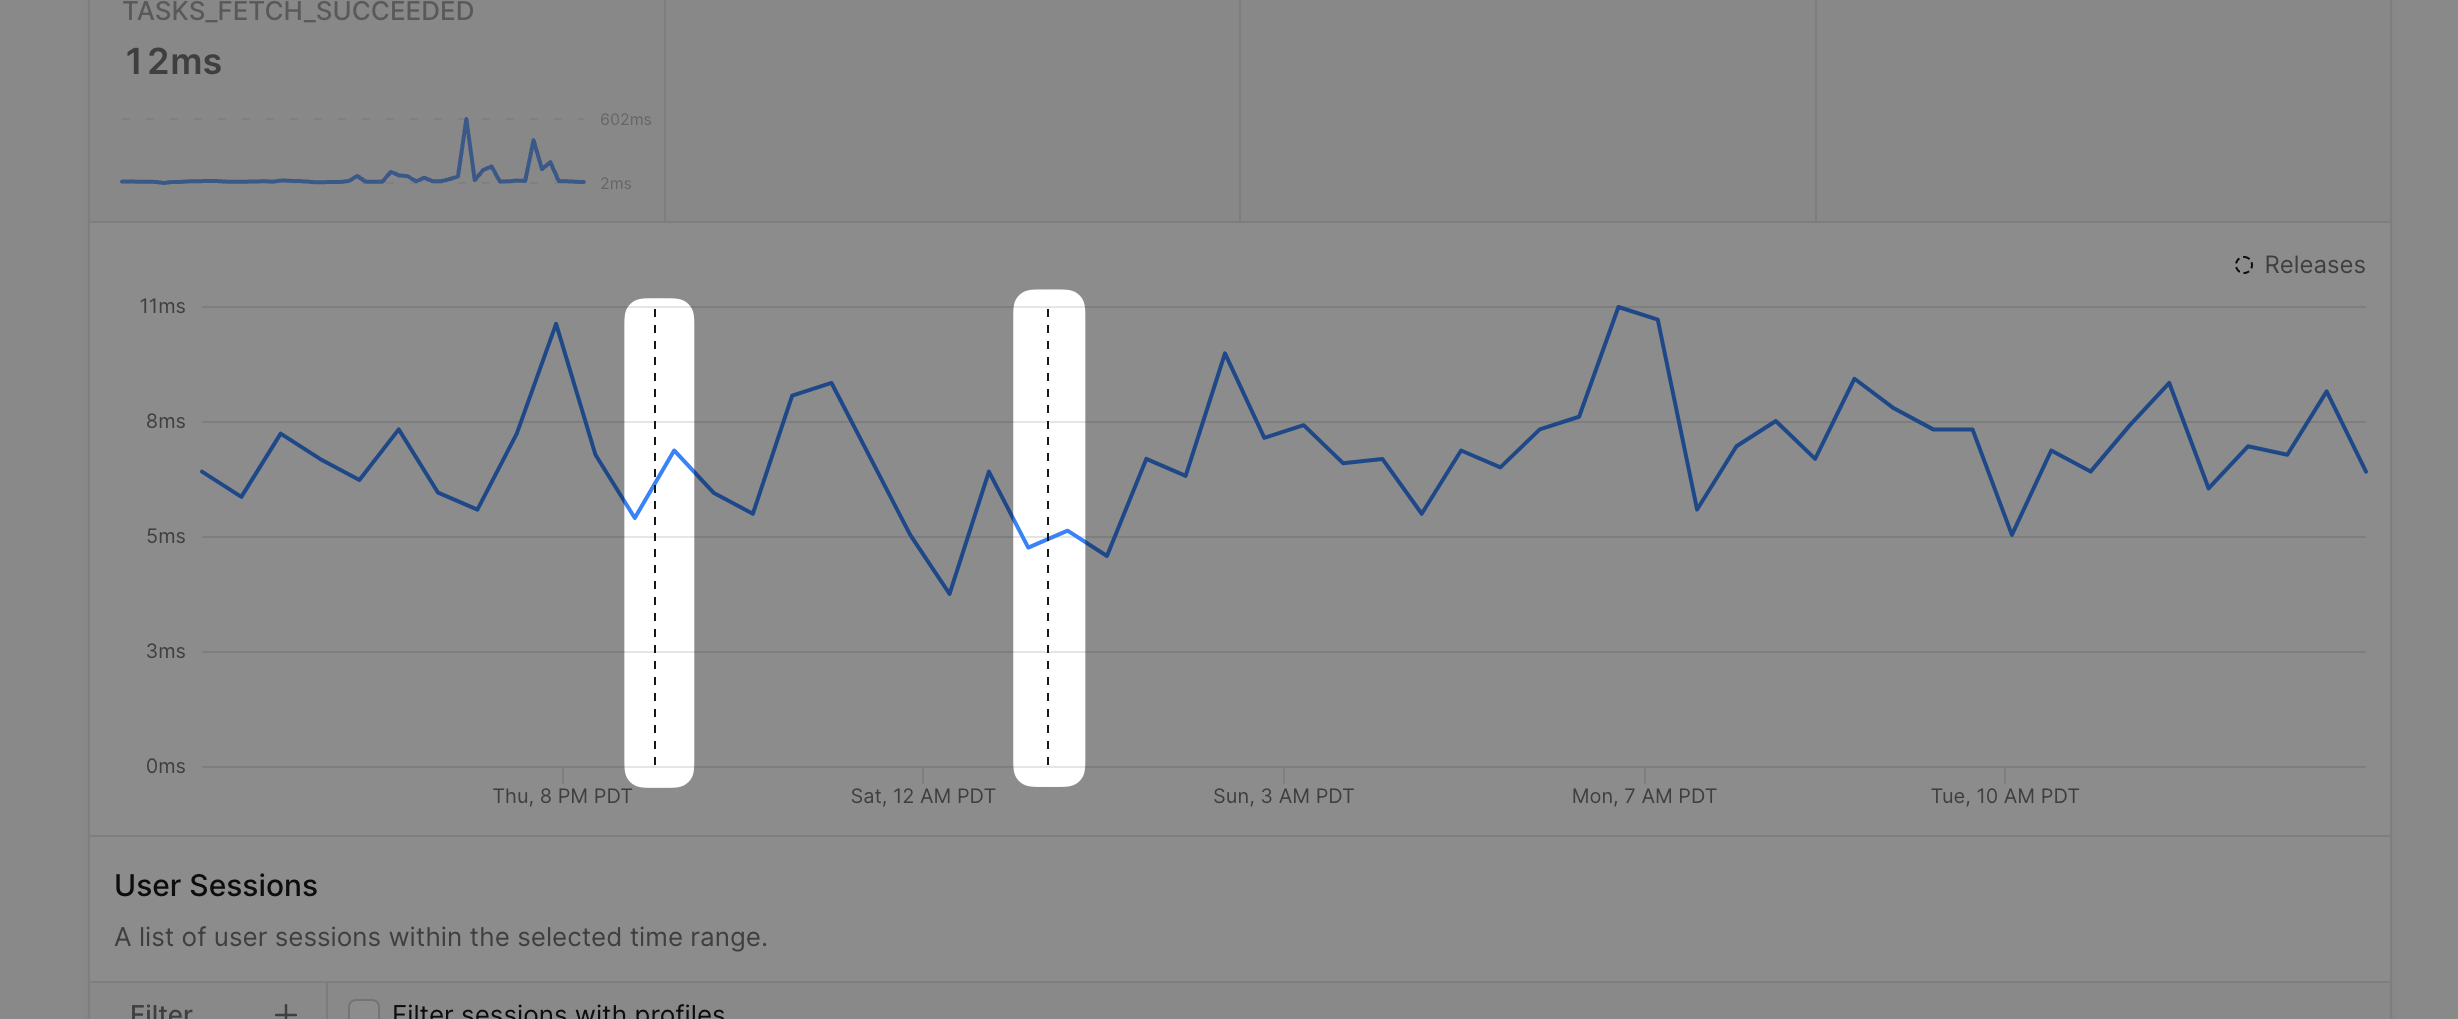
Release Markers
Release Markers denote when a new version of your app was released to production. Alongside metrics, they help you understand how performance changes between versions of your app.
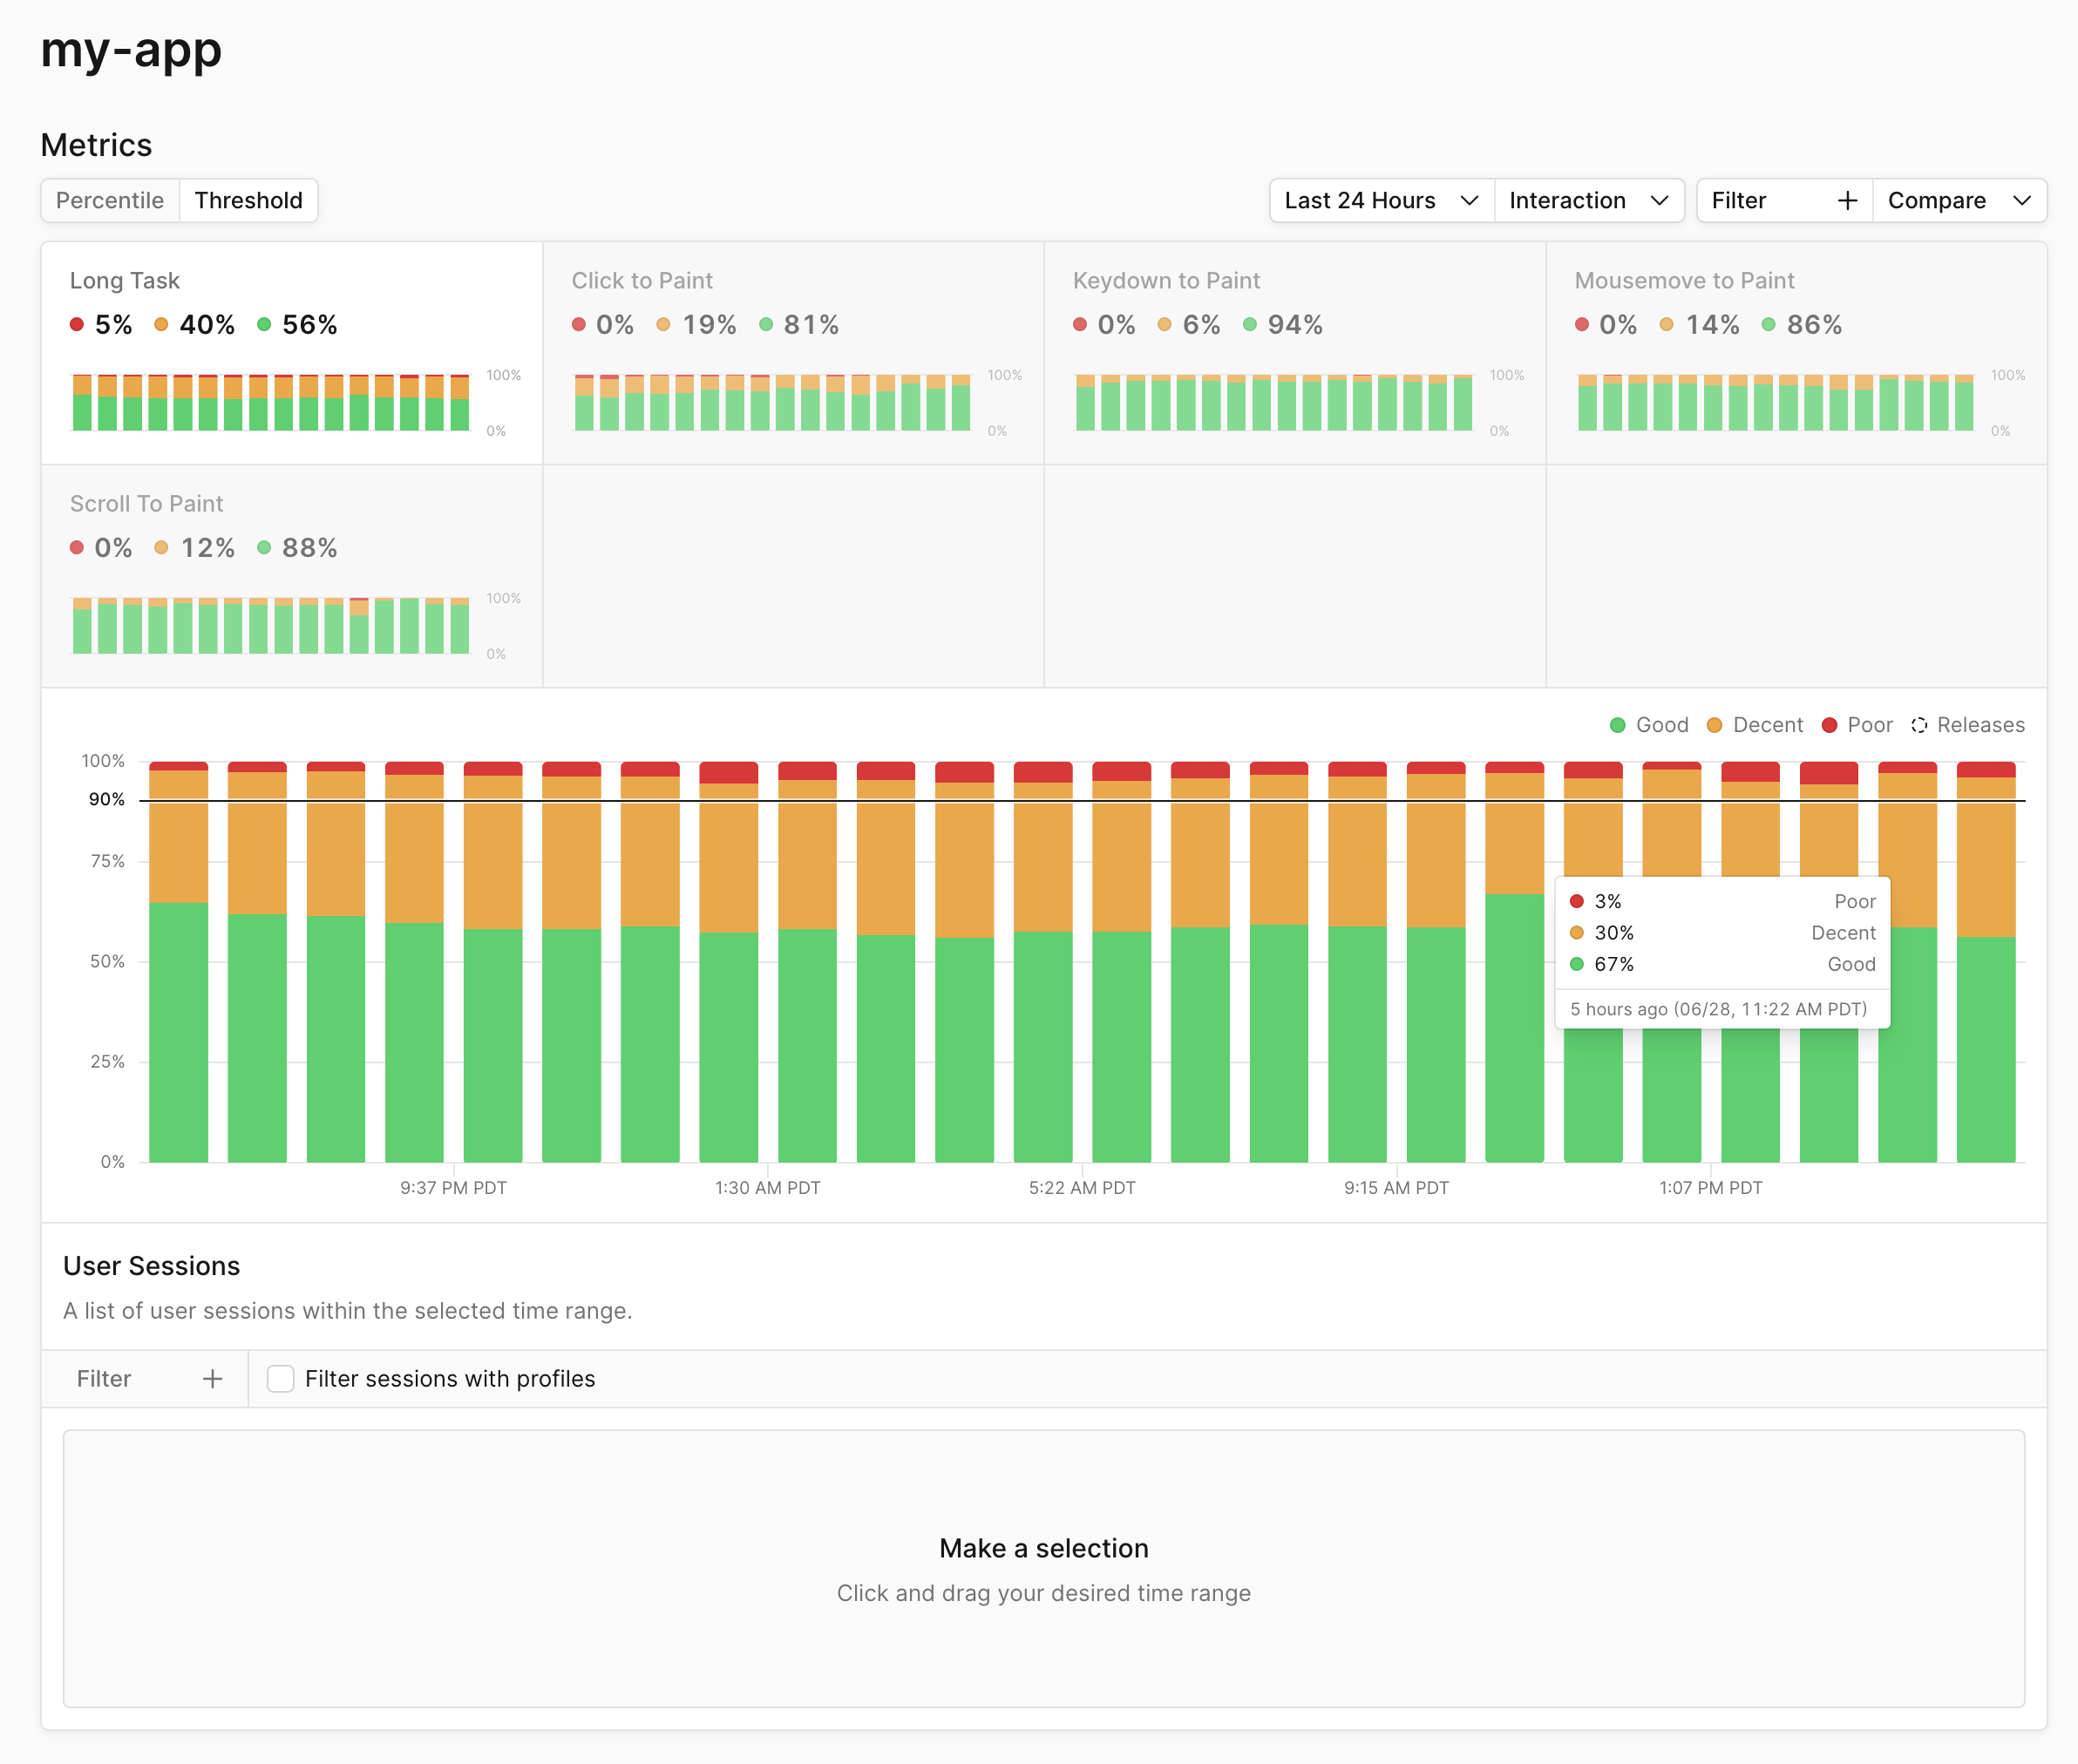
Thresholds
It's often helpful to know what percentage of user experiences are good, decent, or poor. Thresholds denote what percentage of metrics fall into good, decent, and poor cuttoffs. Thresholds are supported for Web Vitals and interaction metrics.
Cuttoffs for Web Vitals follow the recommendations by the Google Chrome team. The cuttoffs for interaction metrics are based on user experience research on perceived response times.