Session Timeline
The Timeline provides an overview of a session's markers and profiles. It allows you to quickly zoom into problematic areas of a session.
Markers
The Timeline shows markers as vertical lines. You can hover over a marker to see its details.
There are 4 kinds of markers shown in the Timeline:
| Marker | Description |
|---|---|
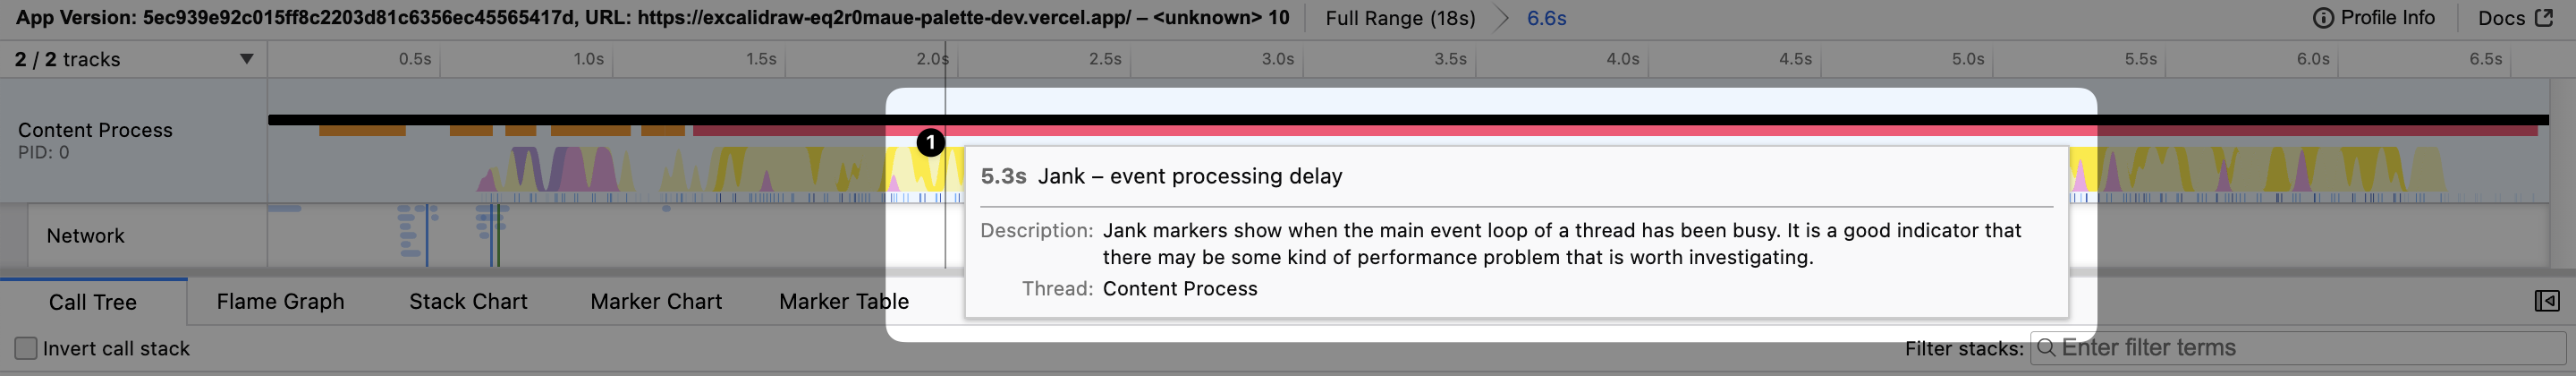
| Jank (aka LongTask) Markers | Indicate a long running task that blocked the main thread. These markers are shown in red and orange, depending on the threshold. |
| Slow Paint Markers | Indicate a slow paint. These markers are shown in red and orange, depending on the threshold. |
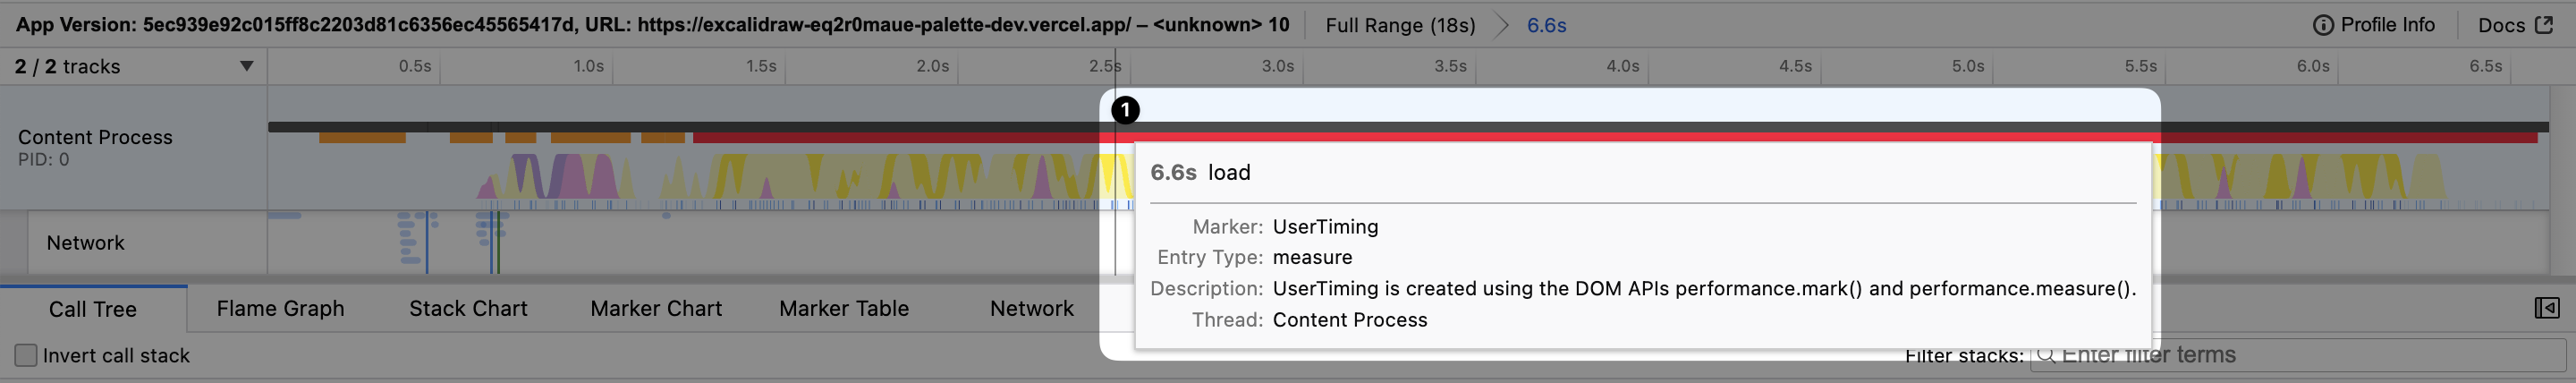
| Custom Markers | Indicate you can add to your code to indicate a specific event. These markers are shown in black. |
| User Interaction Markers | Indicate user interactions such as click, scroll, and keypress events. These markers are shown in blue. |
Example: Custom Markers
Example: Jank Markers
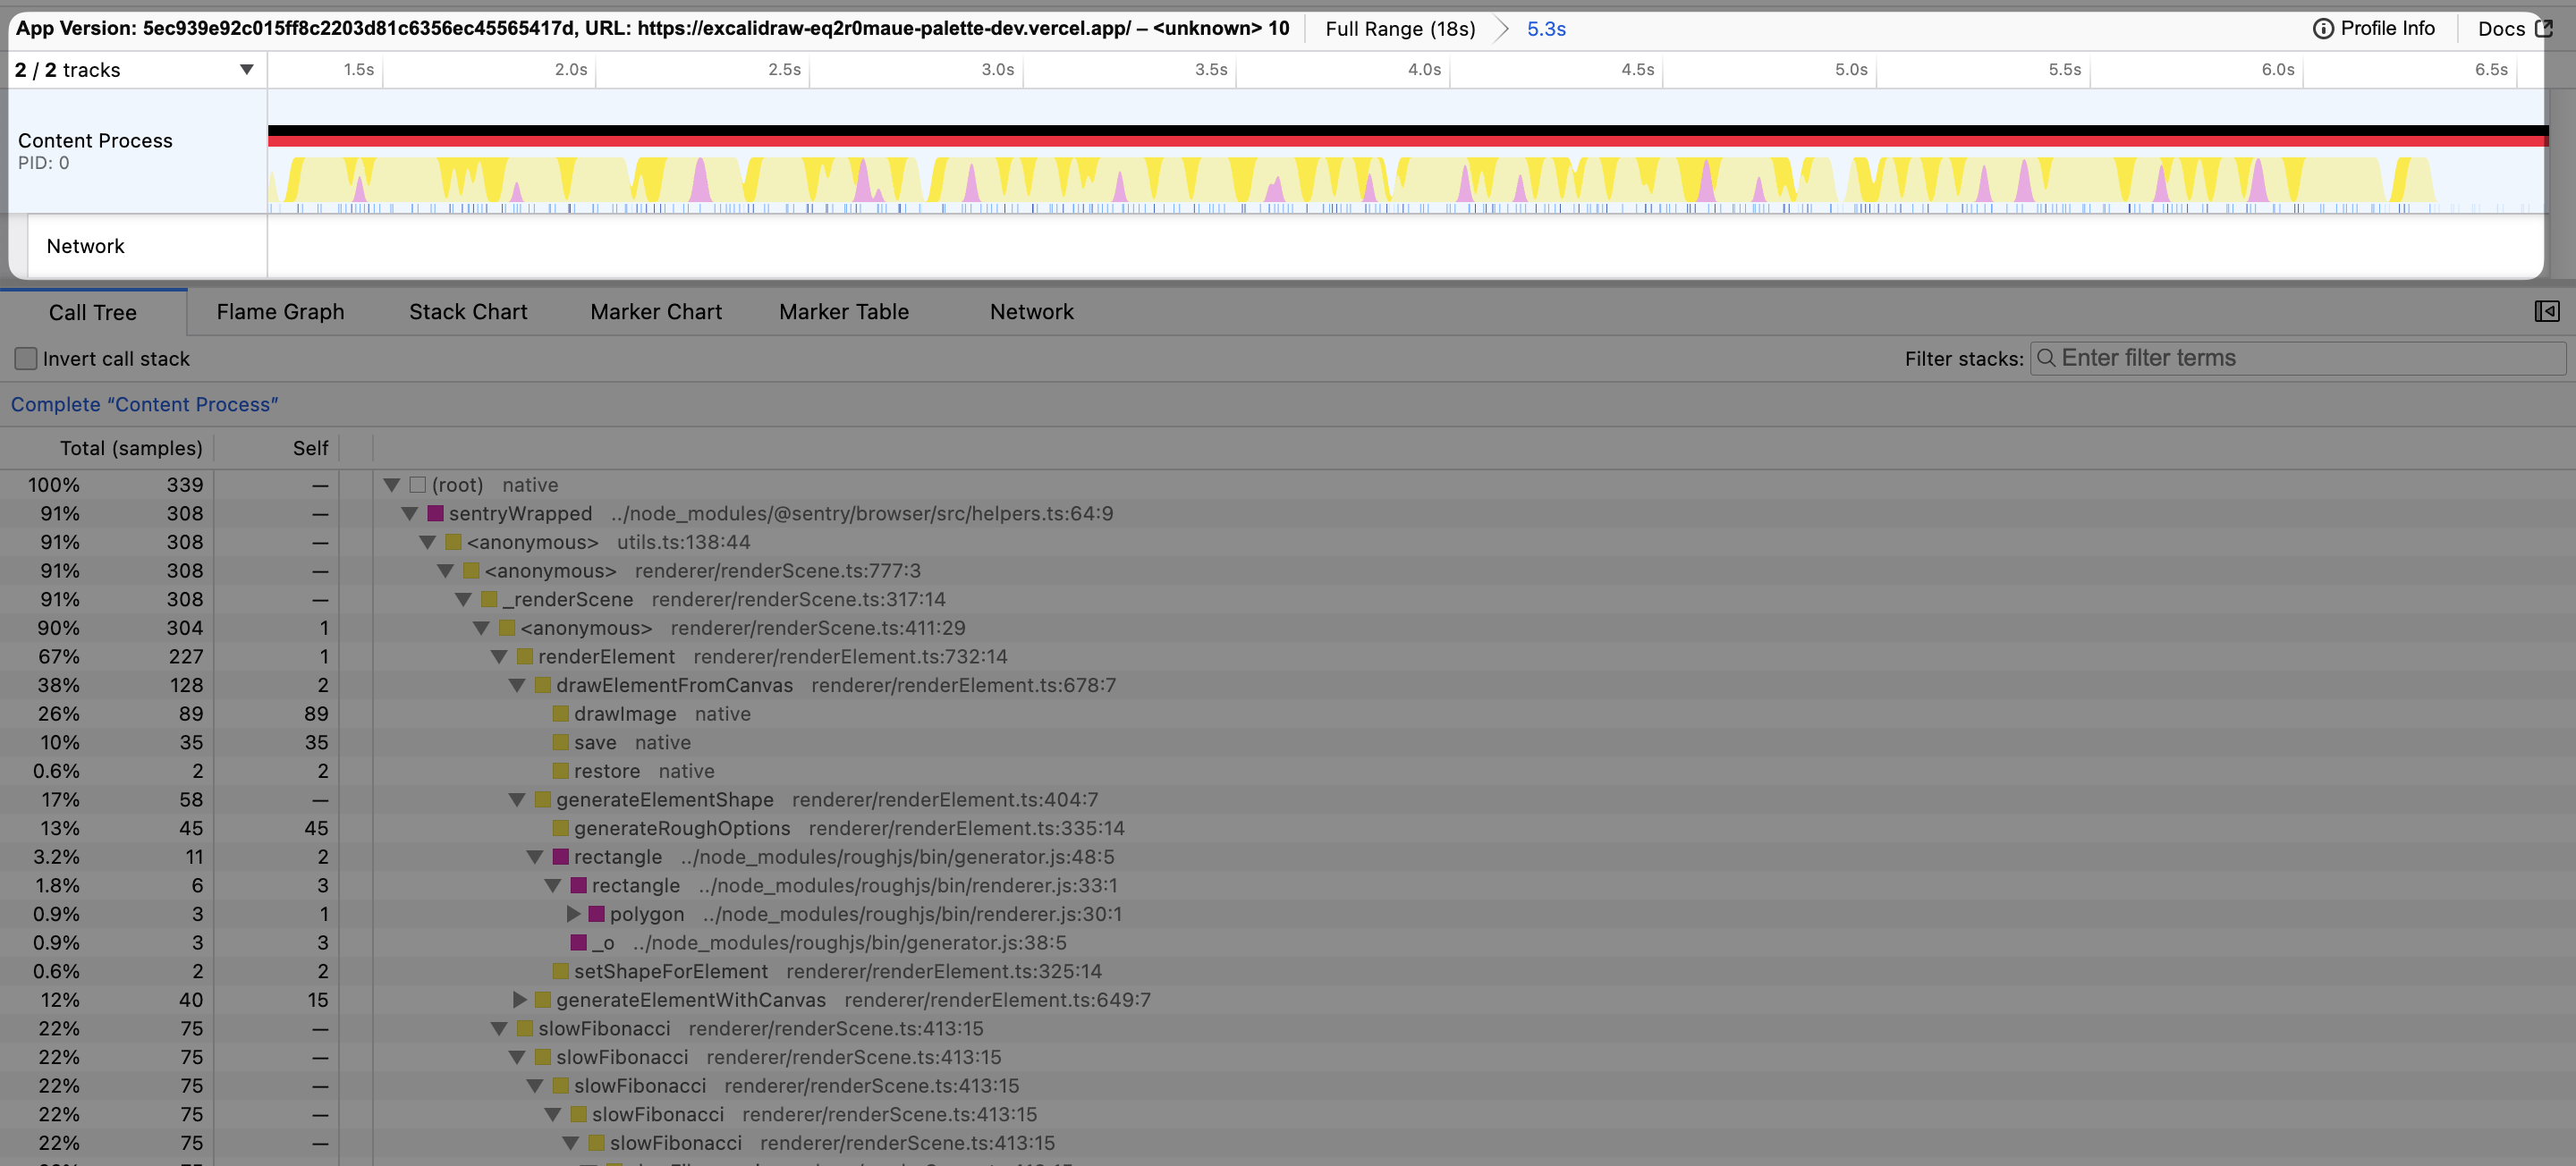
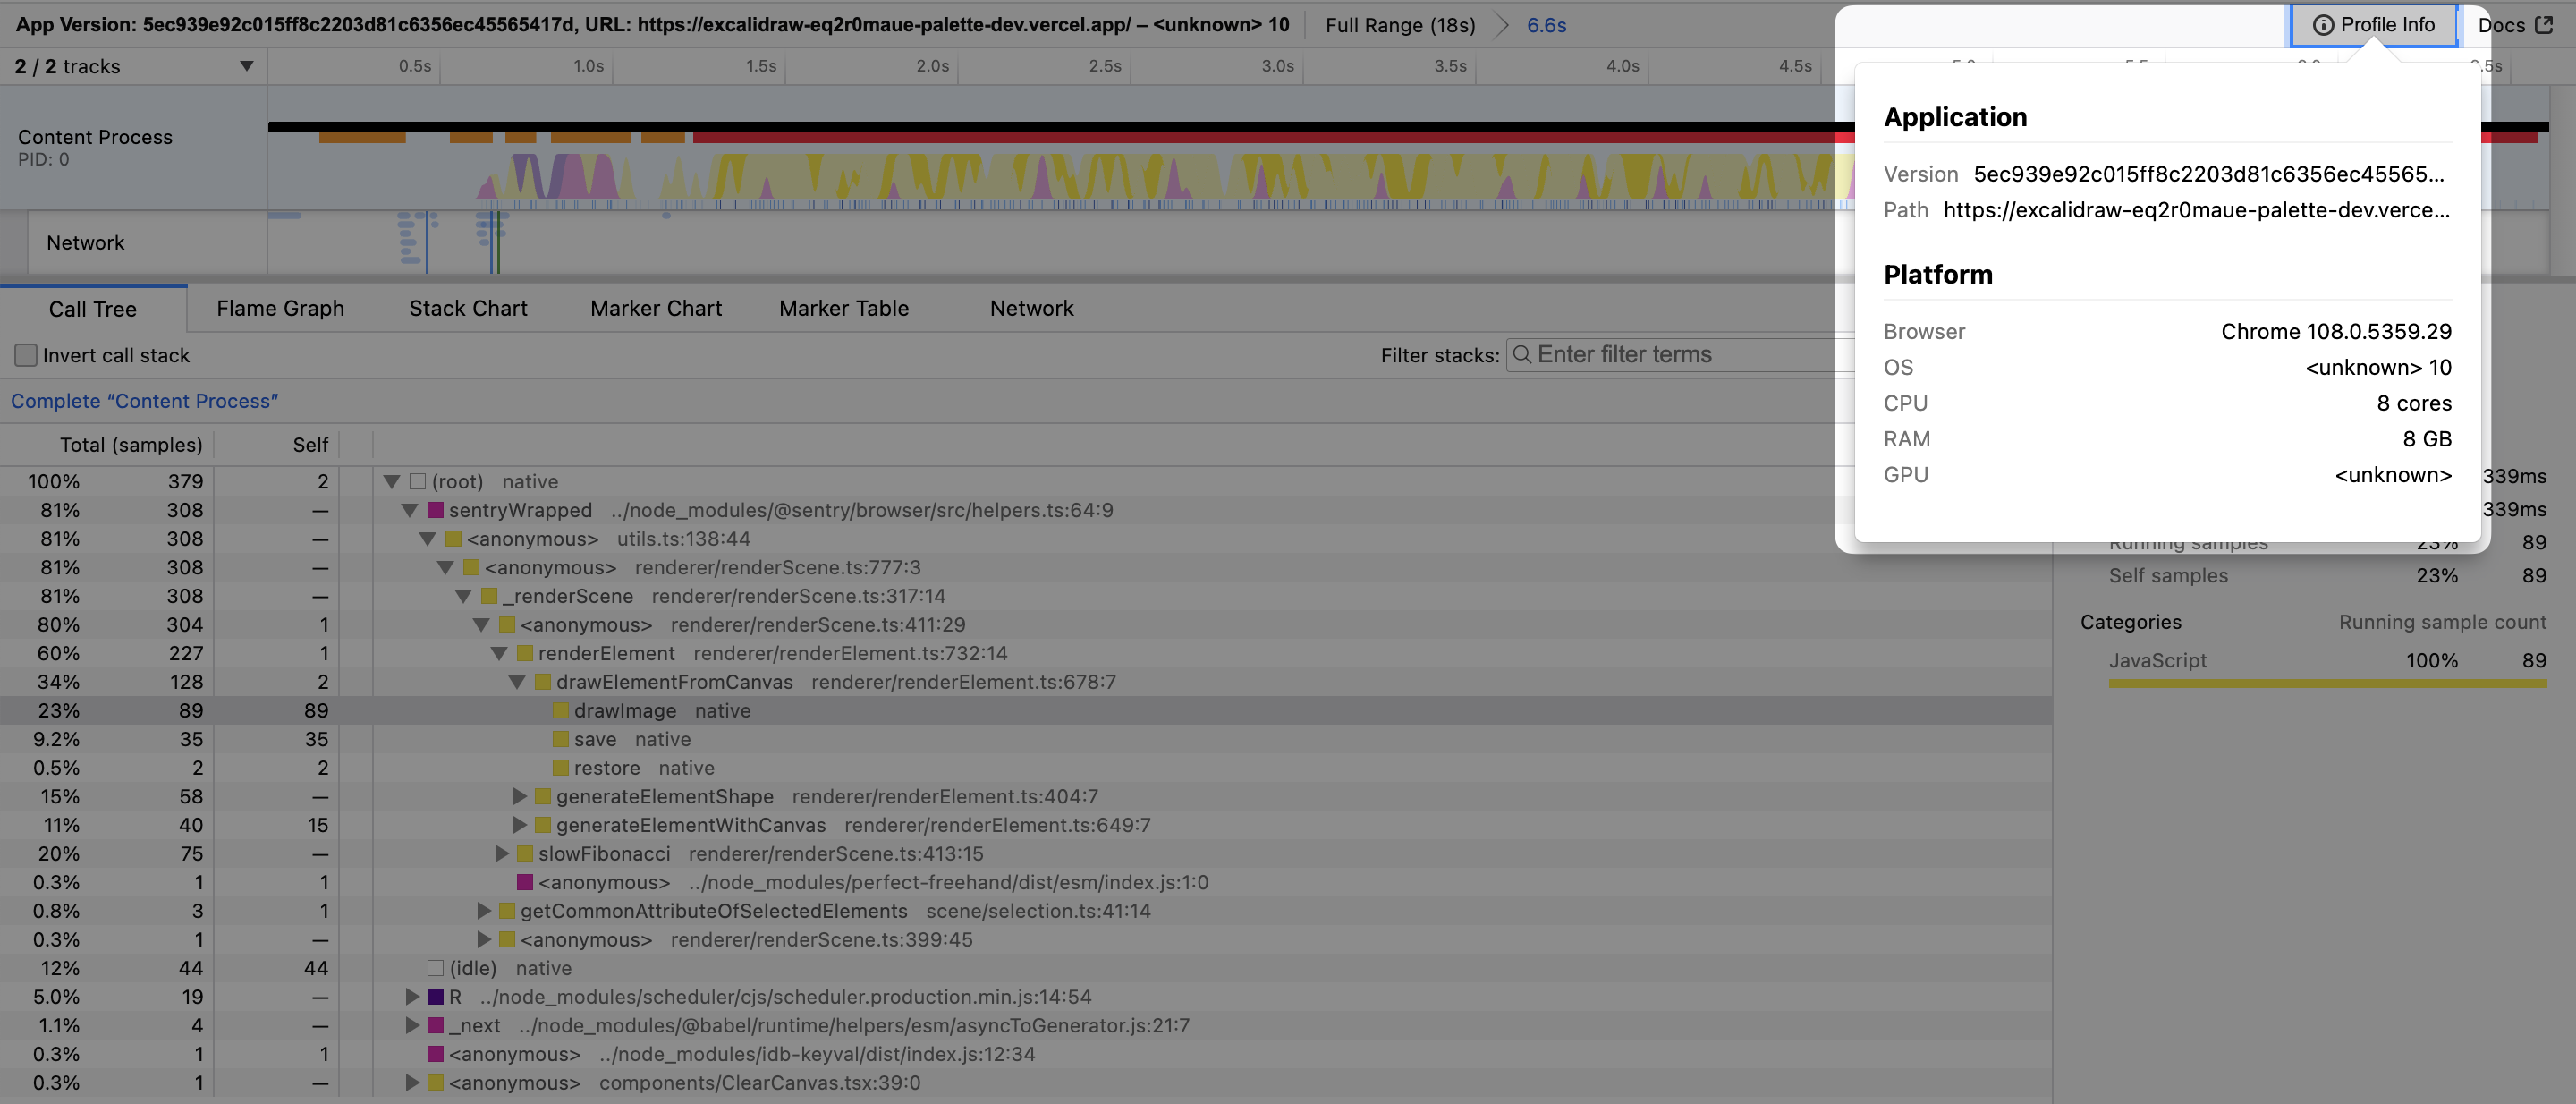
Session Details
The Session Details panel shows information about the session, including the app version, url, and user agent.
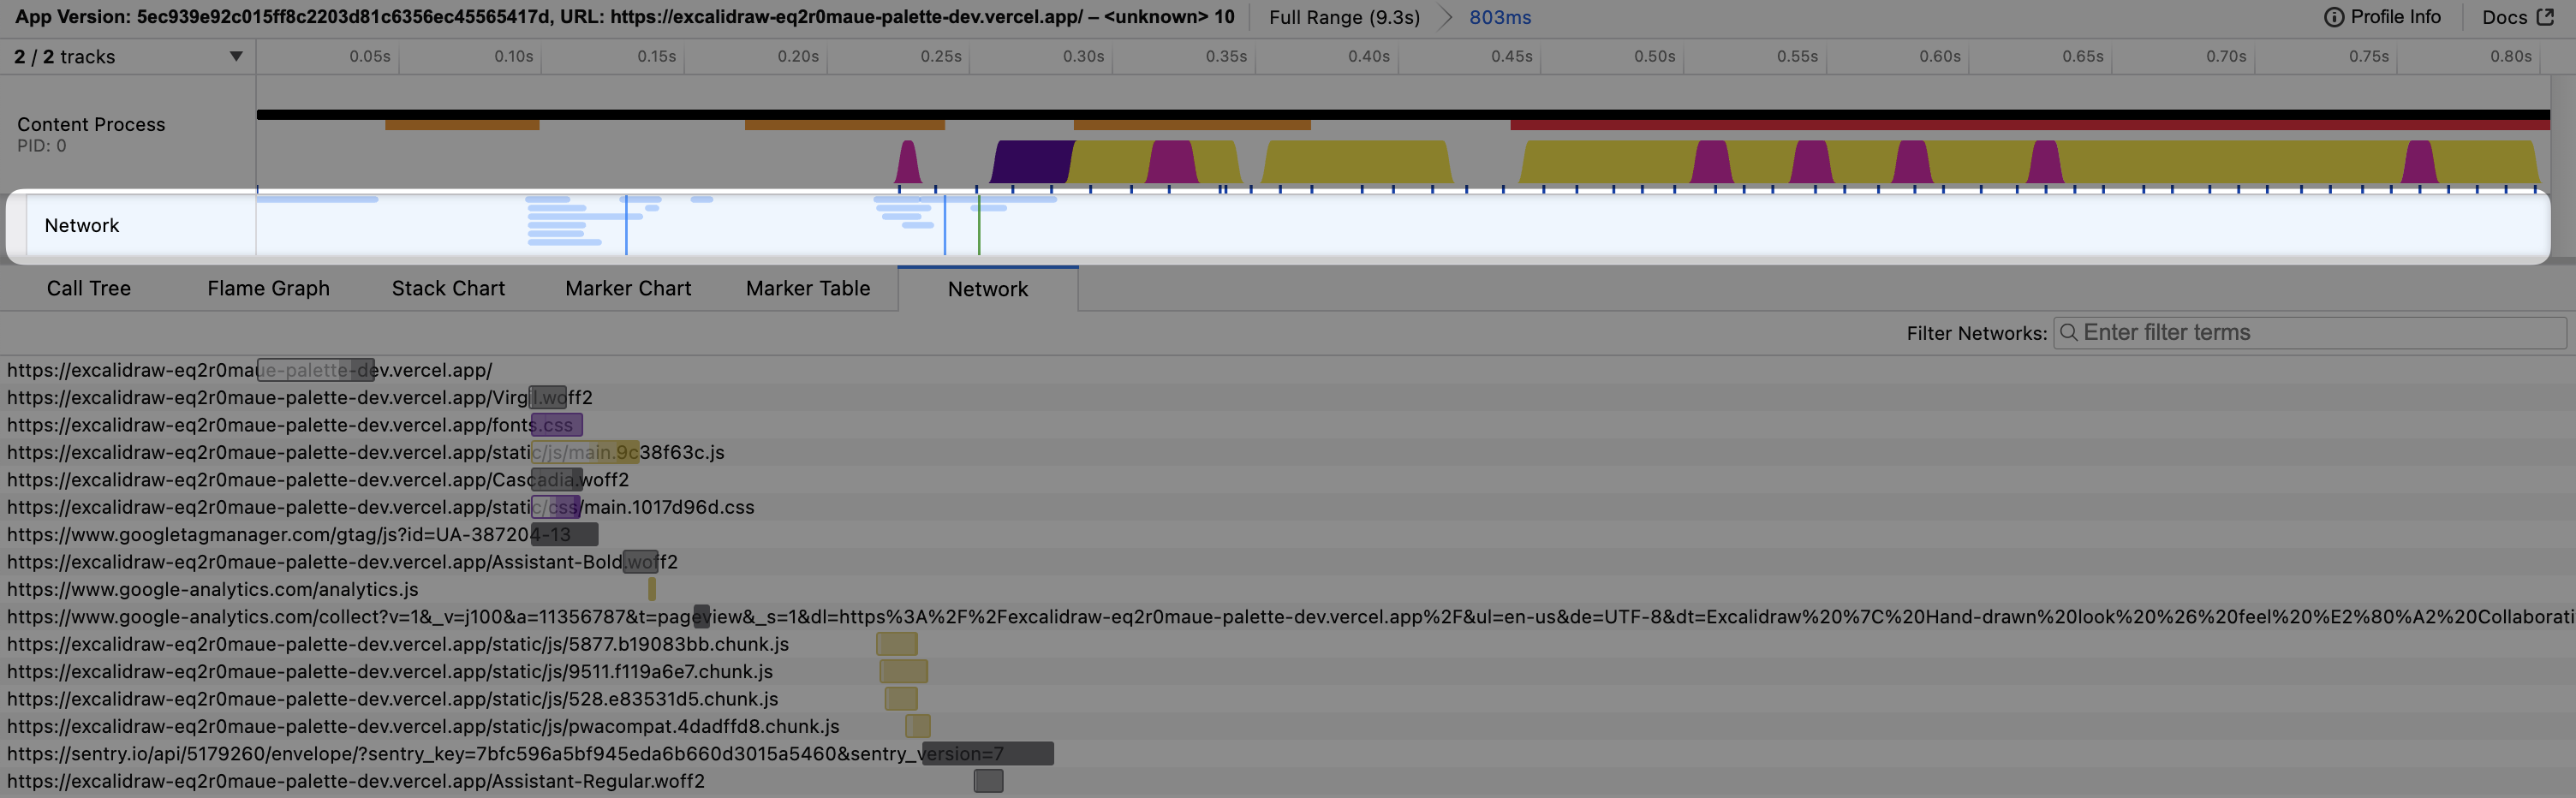
Network
The Network tab shows network requests made during the session. It shows information such as request url, cache hit/miss, duration, and DNS/TLS/TCP timings.
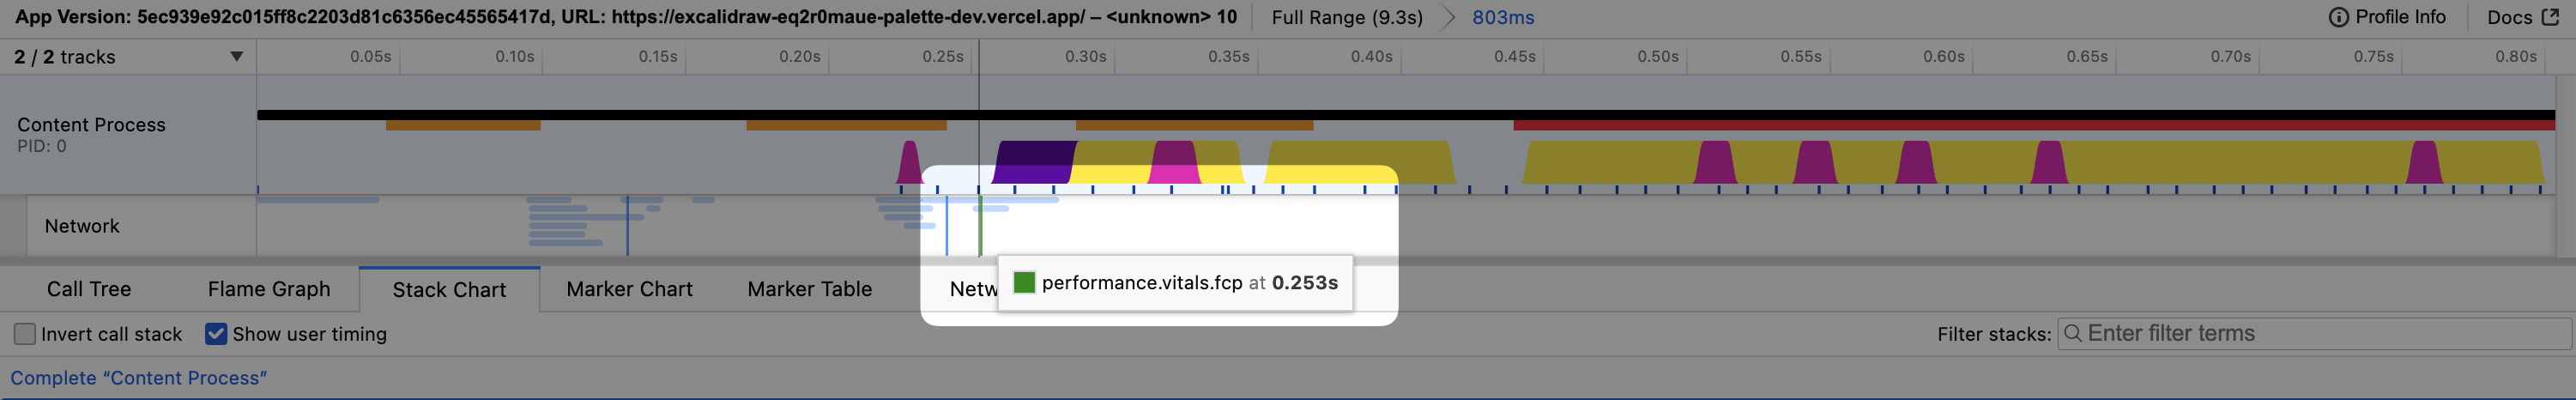
Web Vitals Markers
The Network track shows markers for Web Vitals and page load events such as DOMContentLoaded, load, and domInteractive.