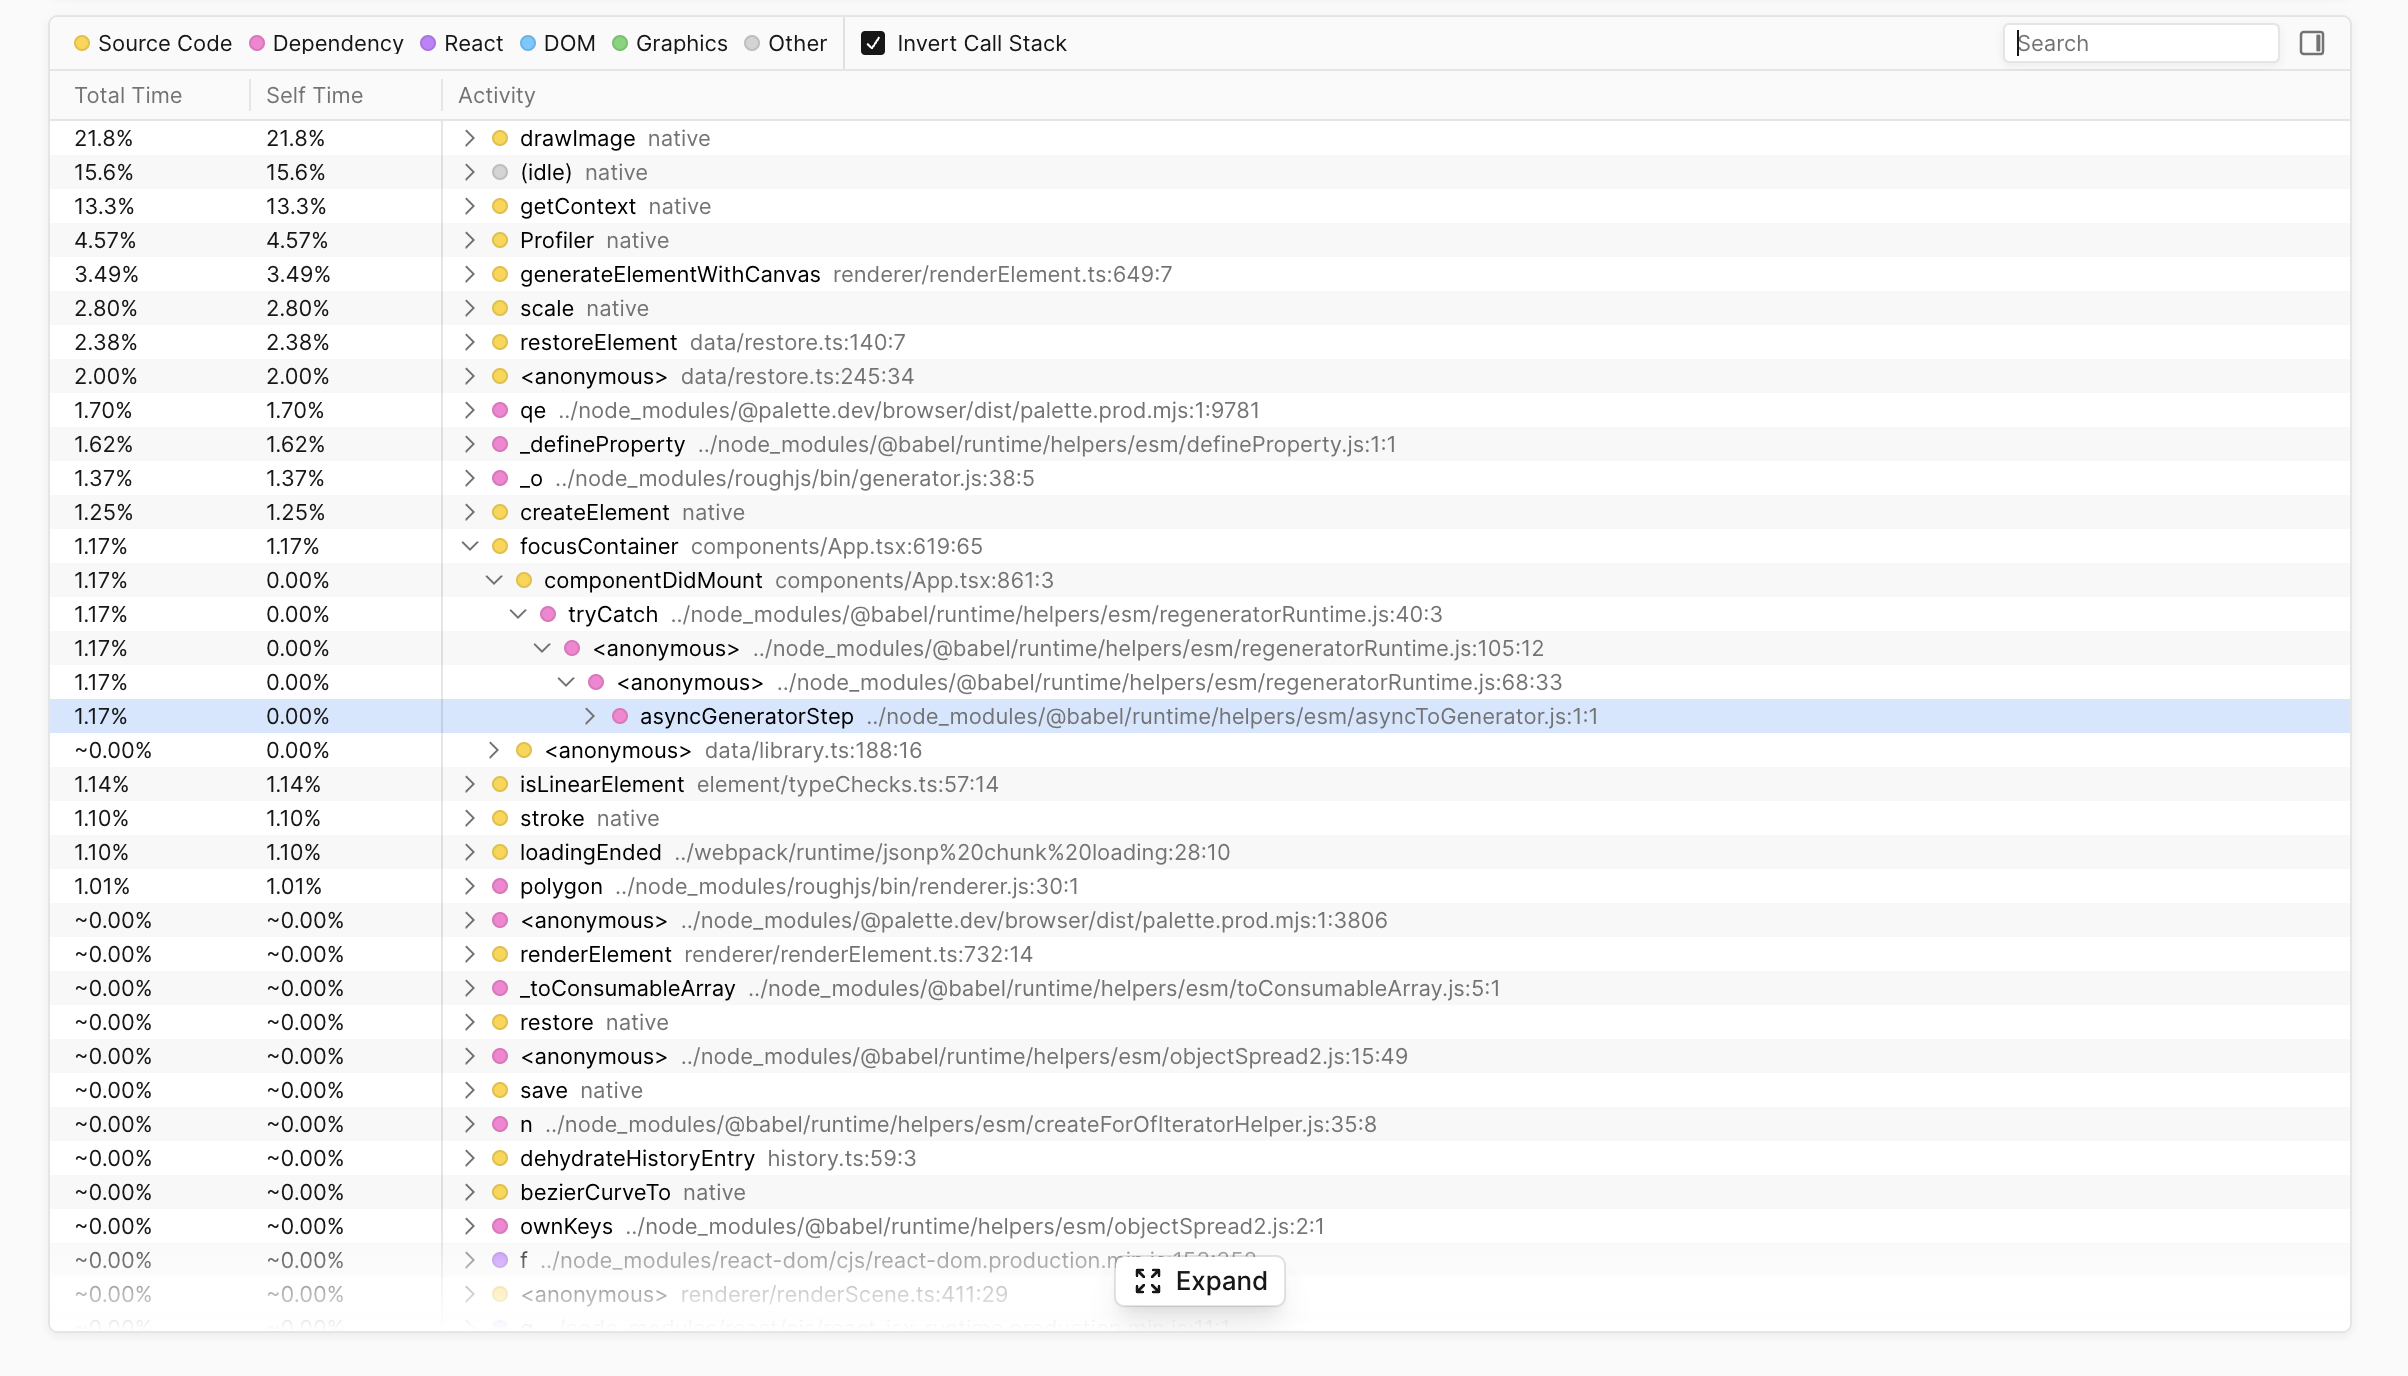
Profile Aggregates Overview
Profile Aggregates summarize how your code behaves across end user sessions. It sorts functions by execution time and compares changes to function execution time.
Profile Aggregates help answer questions such as:
- Which functions regressed the p95 of click responsiveness between versions v1 and v2 of my app?
- Which functions are blocking keypress responsiveness on mobile devices in the last release?
- Which functions regressed my “dashboard_render_time” custom metric on the
/dashboardpage?
Concepts
Profile Sample
A snapshot of the current stack at a given time.
Sampling Profiler
A profiler technique which samples the stack at given intervals.
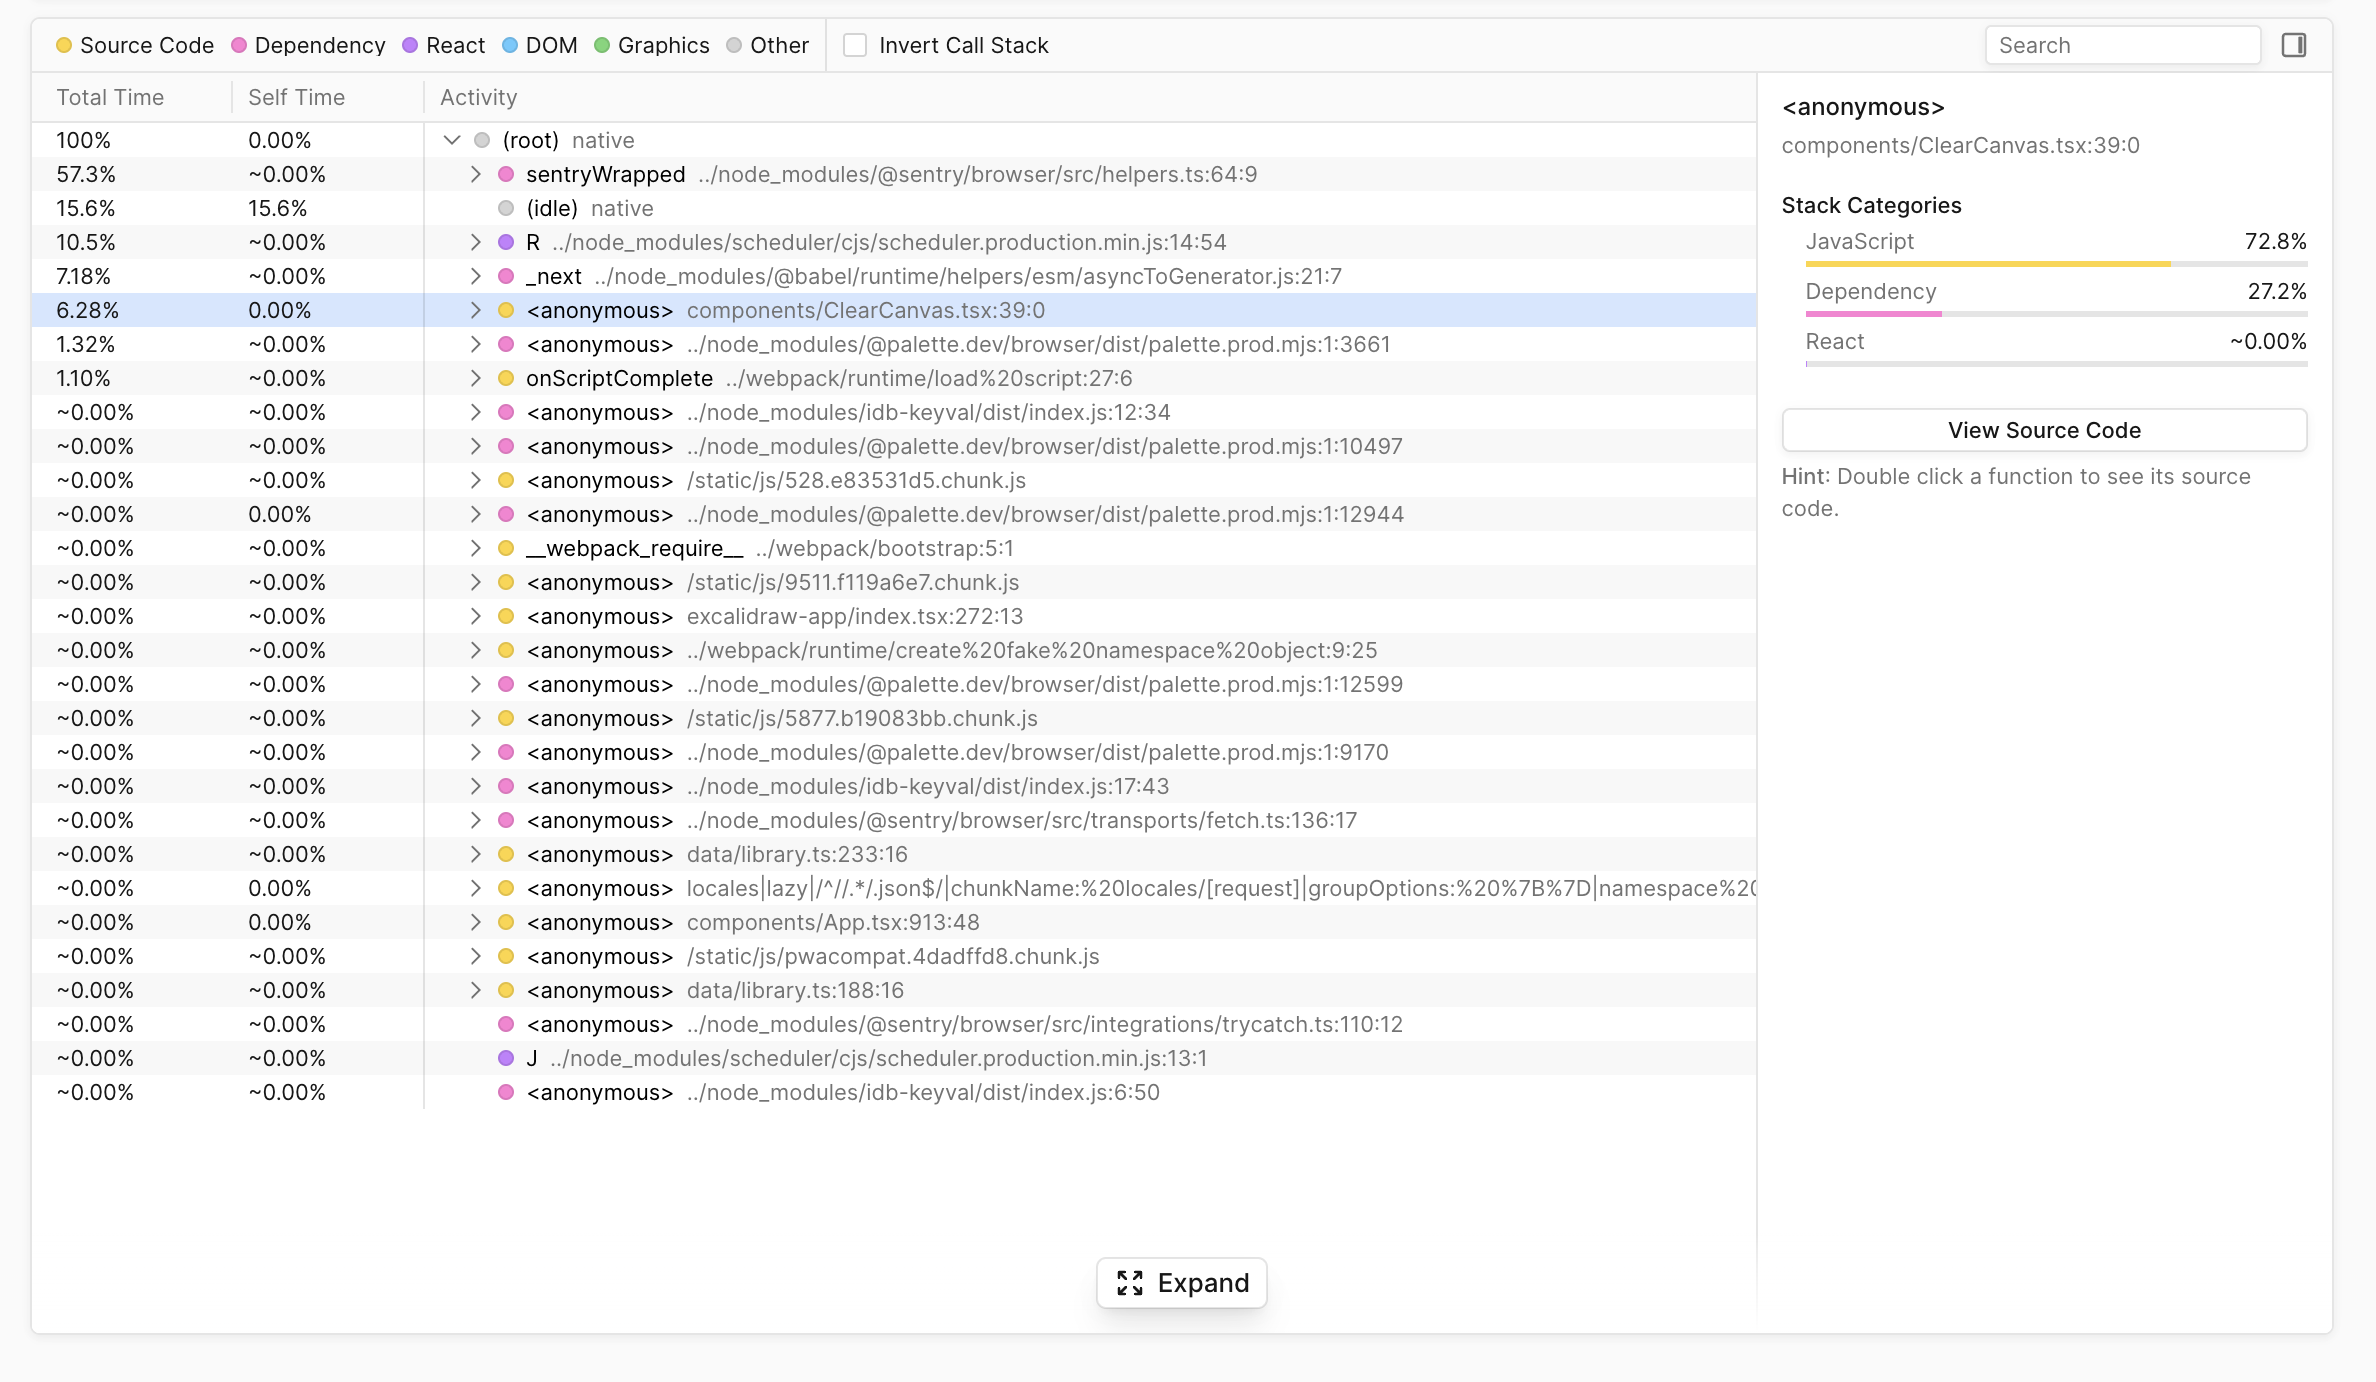
Total Time
The amount of time, as a percentage, that a function has been on the stack. A function may have a large total time without having much impact on performance. Functions with timings of ~0.00% have been truncated because their value is less than 0.01%.
Self Time
The amount of time, as a percentage, that a function has been on top of the stack. Functions with a large self time are often candidates for optimization.
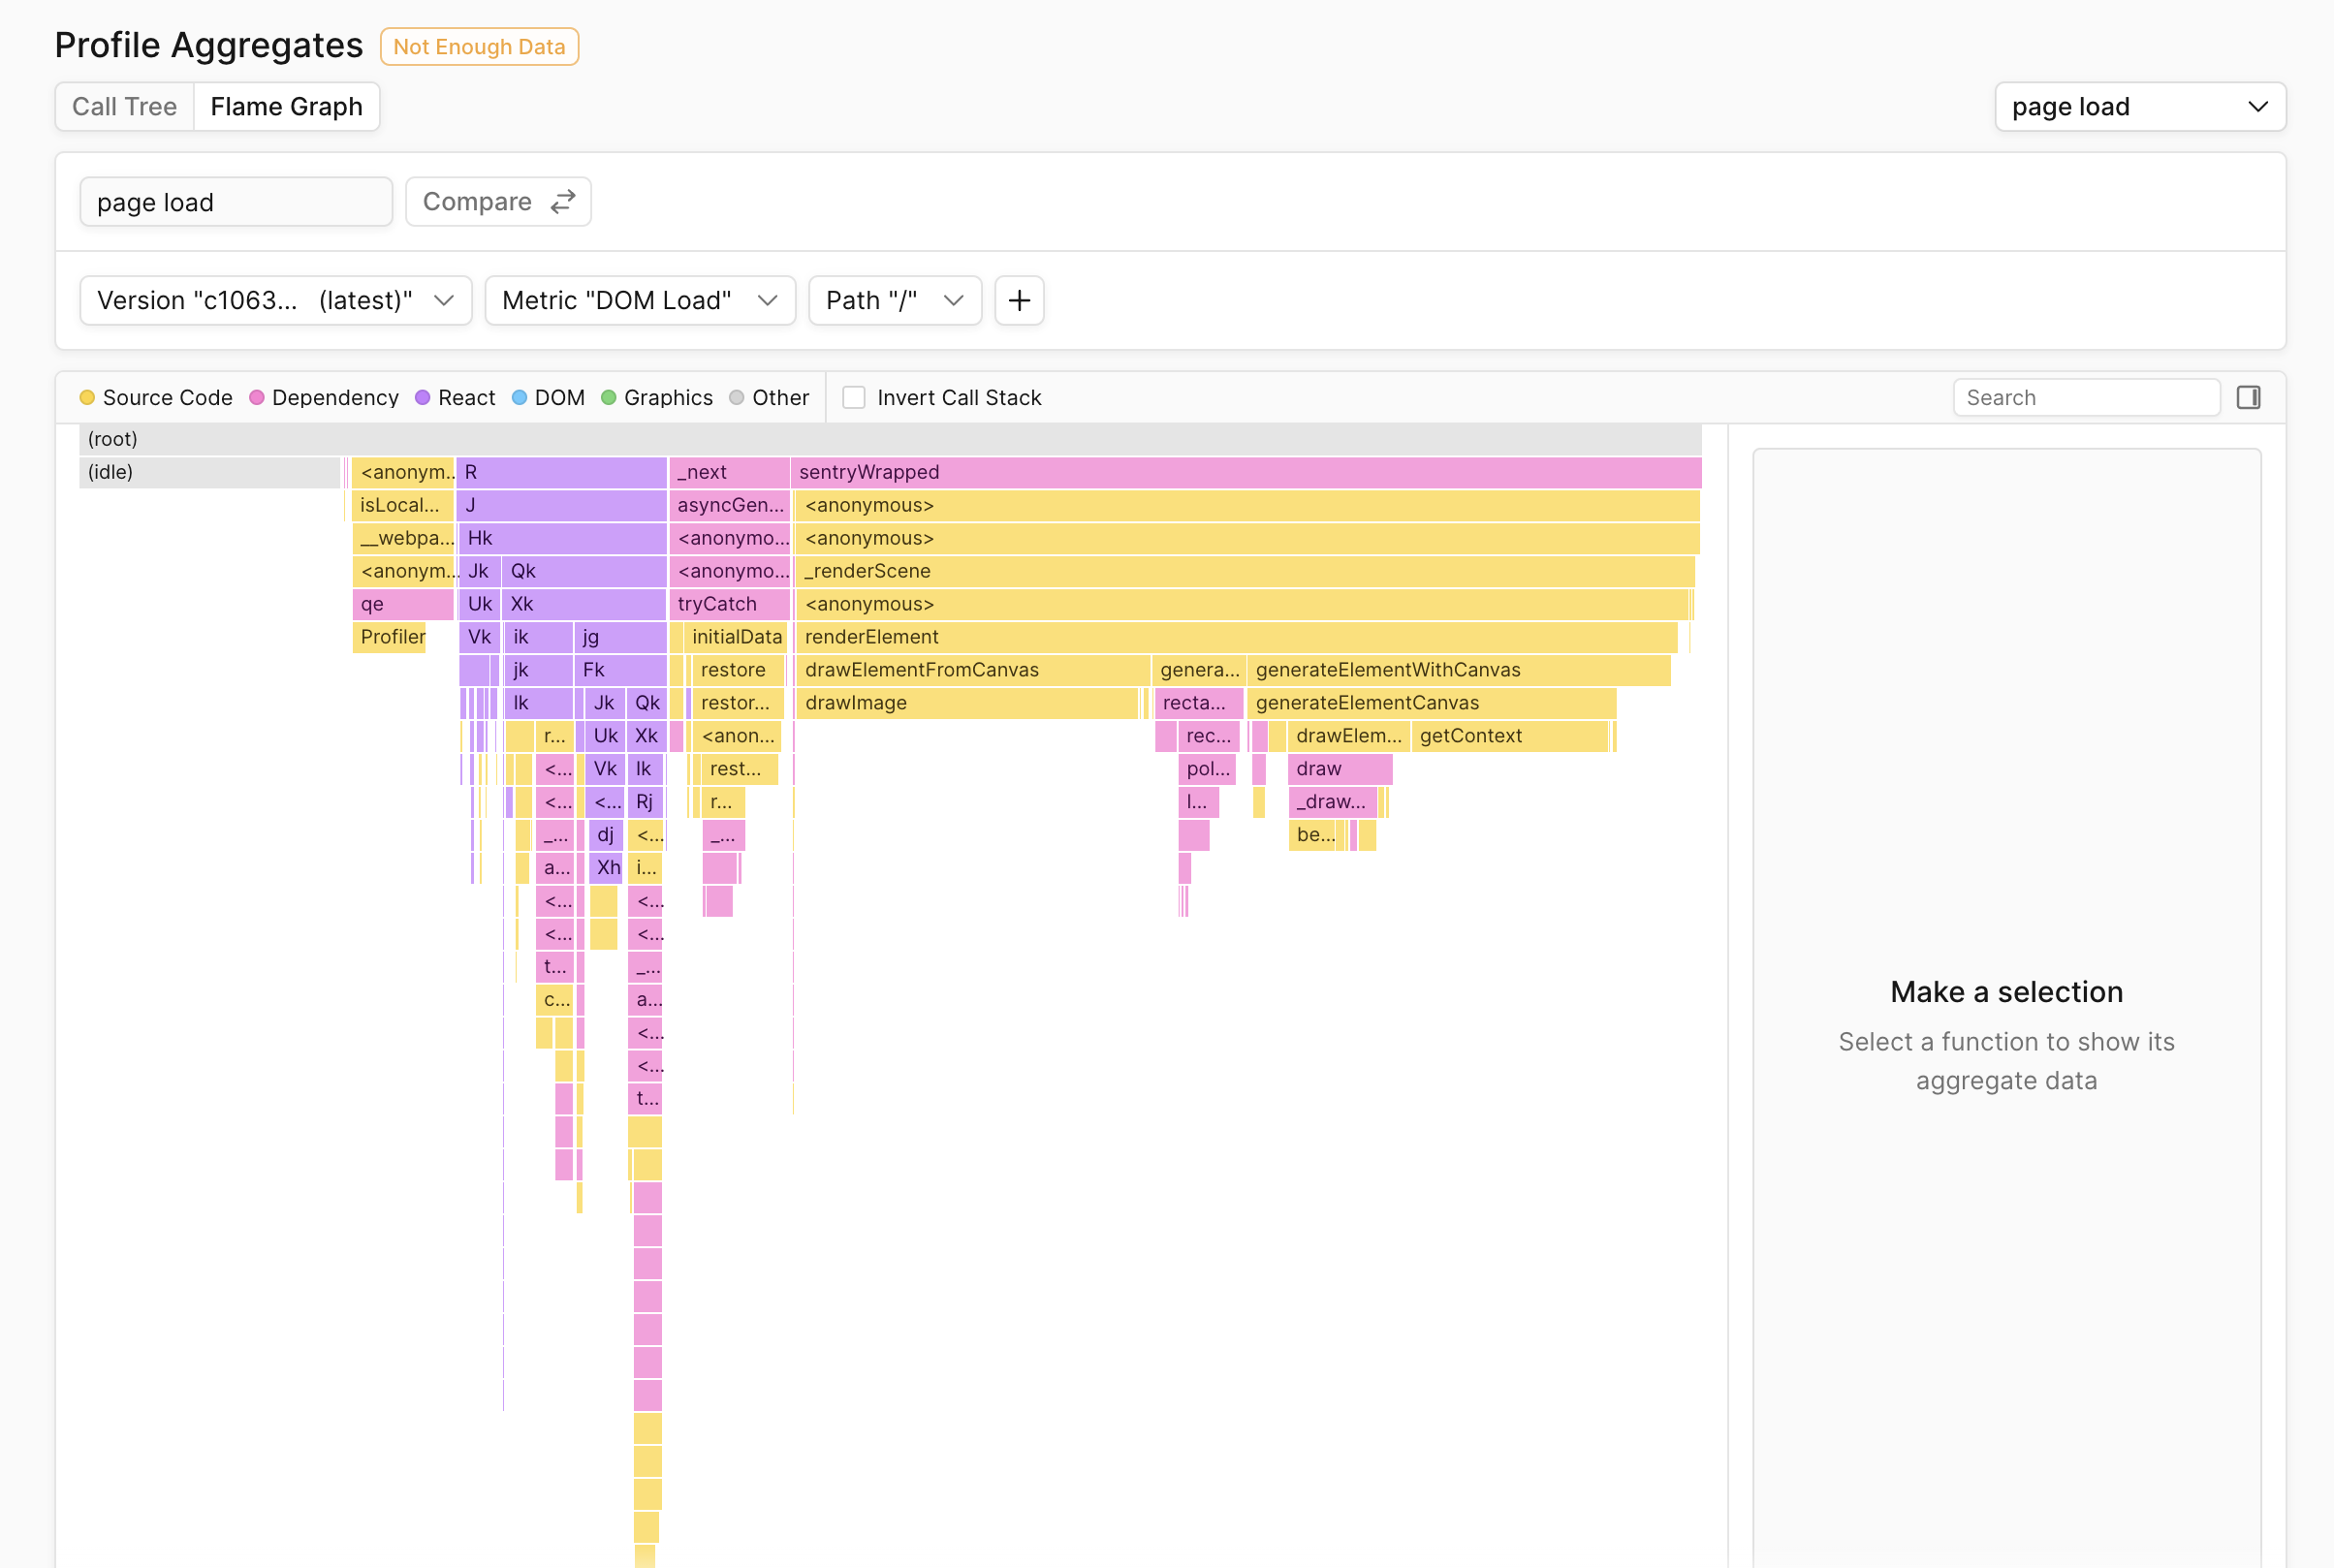
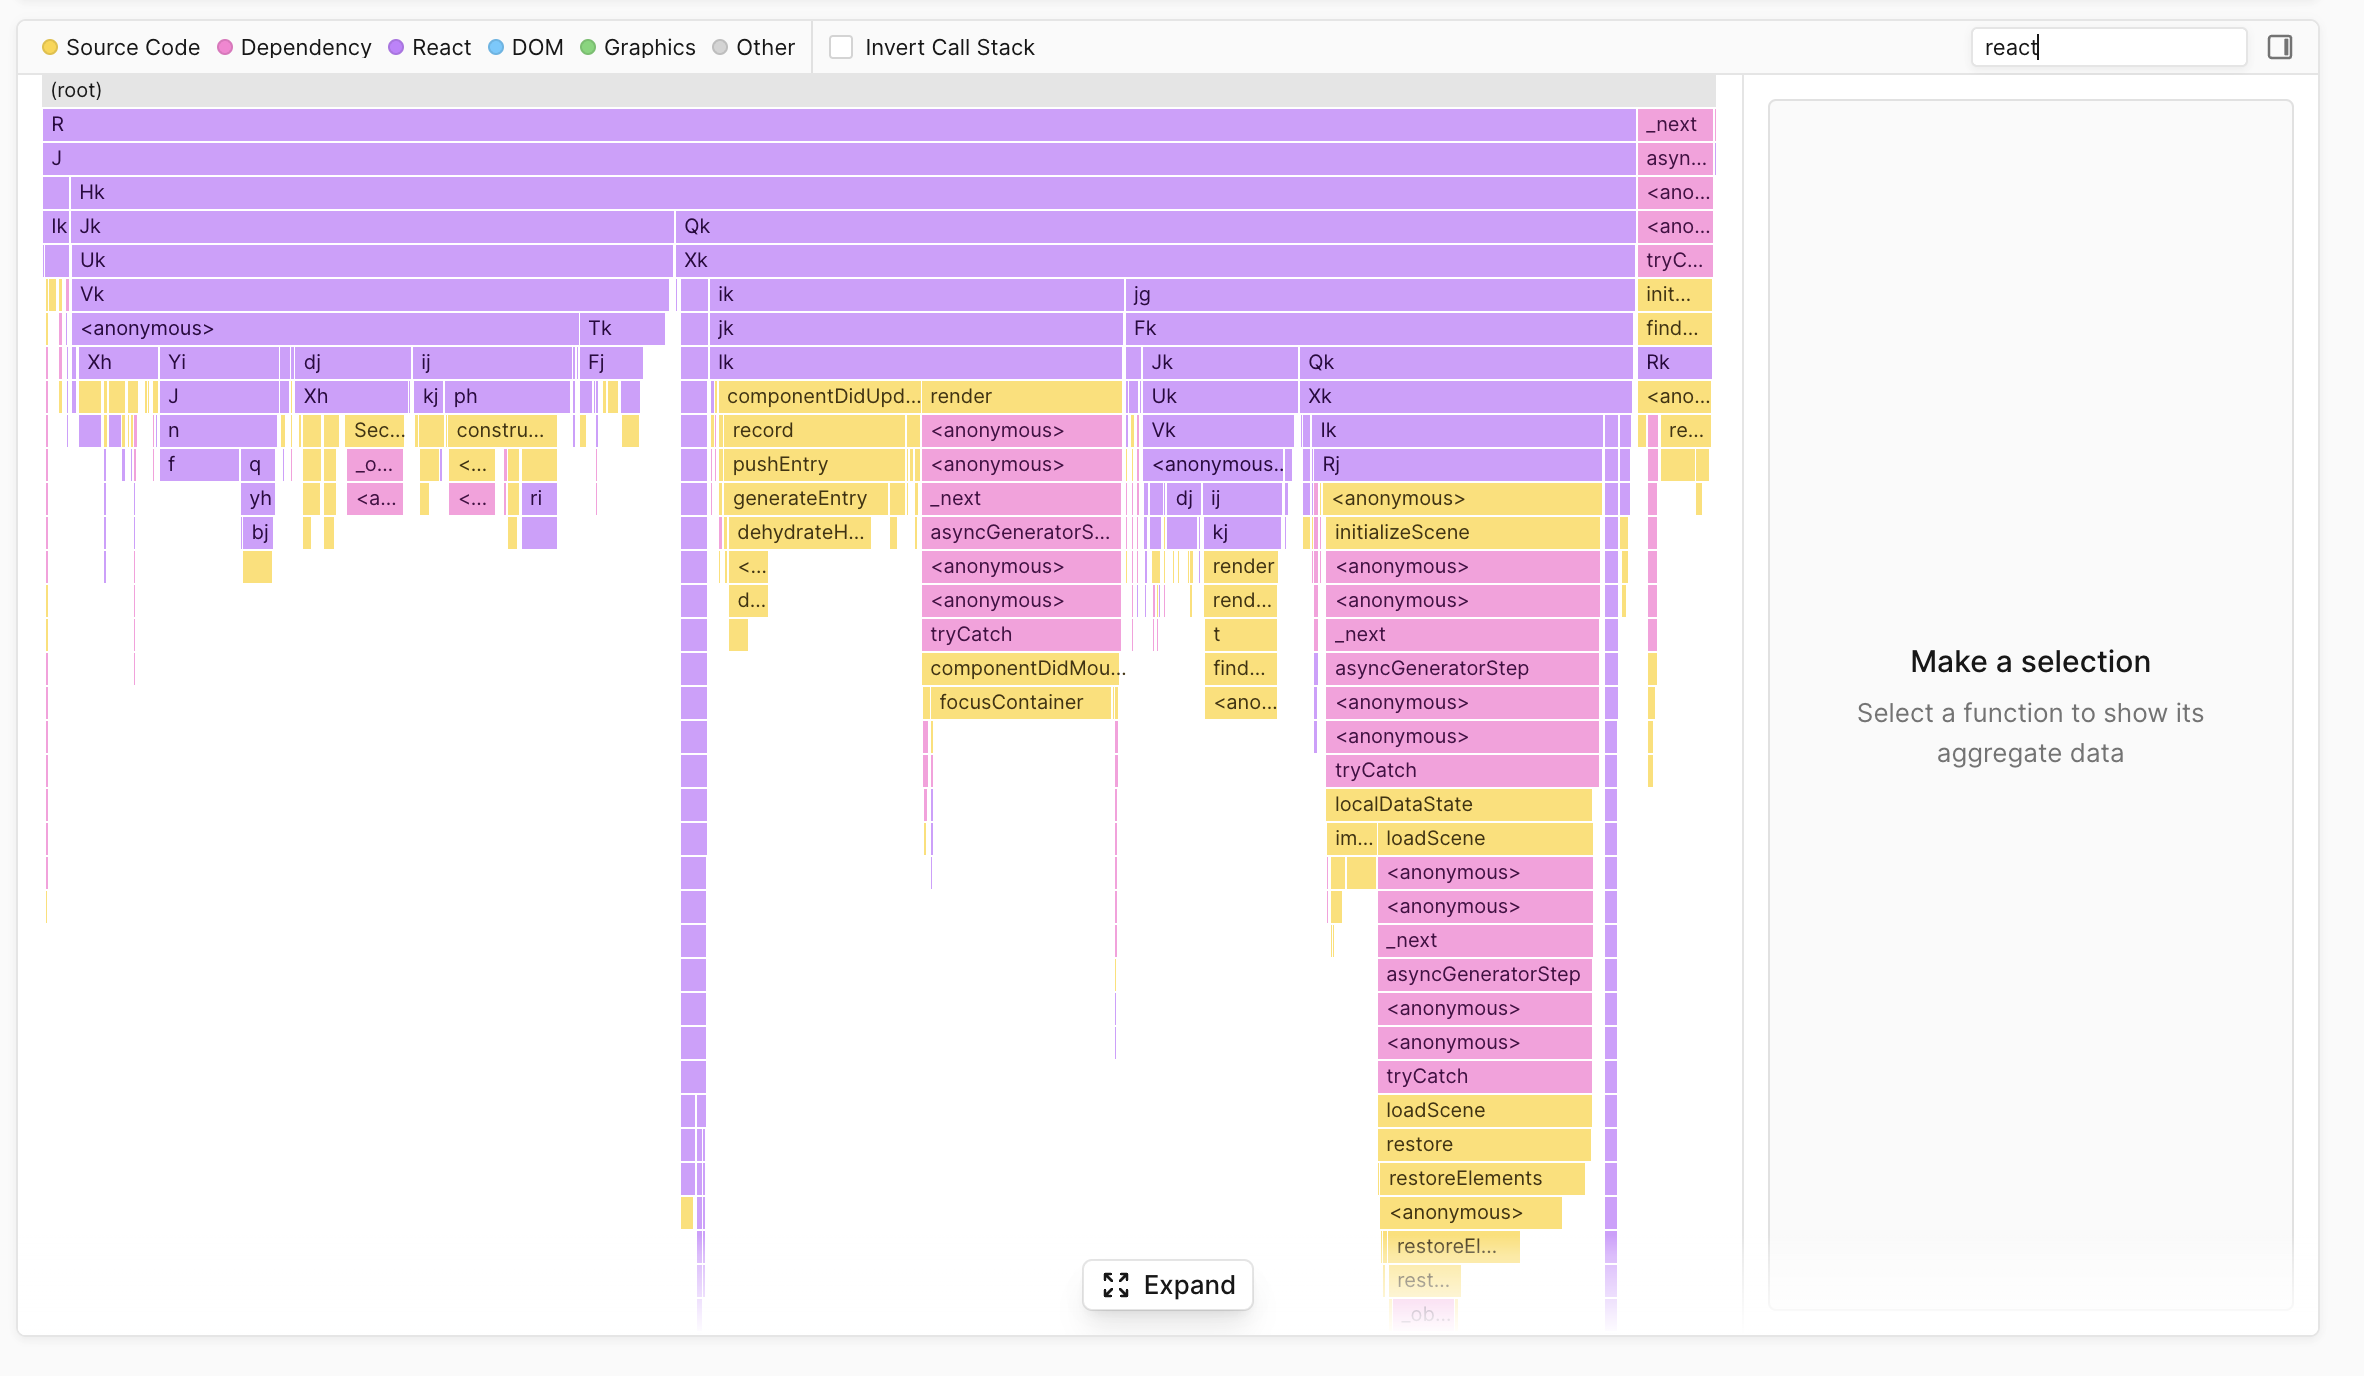
Visualizing Profiles
Profiles can be visualized in two ways in Palette: call trees and flame graphs.
Call Trees
A call tree visualizes function execution as a list-hierarchy. Parent nodes represent functions that call another function, and the called function is represented as a child.
Flame Graphs
The Flame Graph provides a more visual view into the same call tree structures:
- Larger rectangles indicate greater running time.
- The rectangles at the top are the stacks contributing to self time, where the program actually spends time.
- Functions are sorted alphabetically in ascending order from left to right.
Some users will prefer using the flame graph over the call tree because it's much more visual.
Categories
The sidebar gives a breakdown of the categories of the code running inside the selected function.
Functions are categorized as:
- Source Code: Your code
- React:
react,react-dom,schedulerpackages - Dependencies:
node_modules - Graphics: Canvas, WebGL, SVG Web APIs
- DOM: DOM APIs
Search
Functions can be searched for by name and file name.
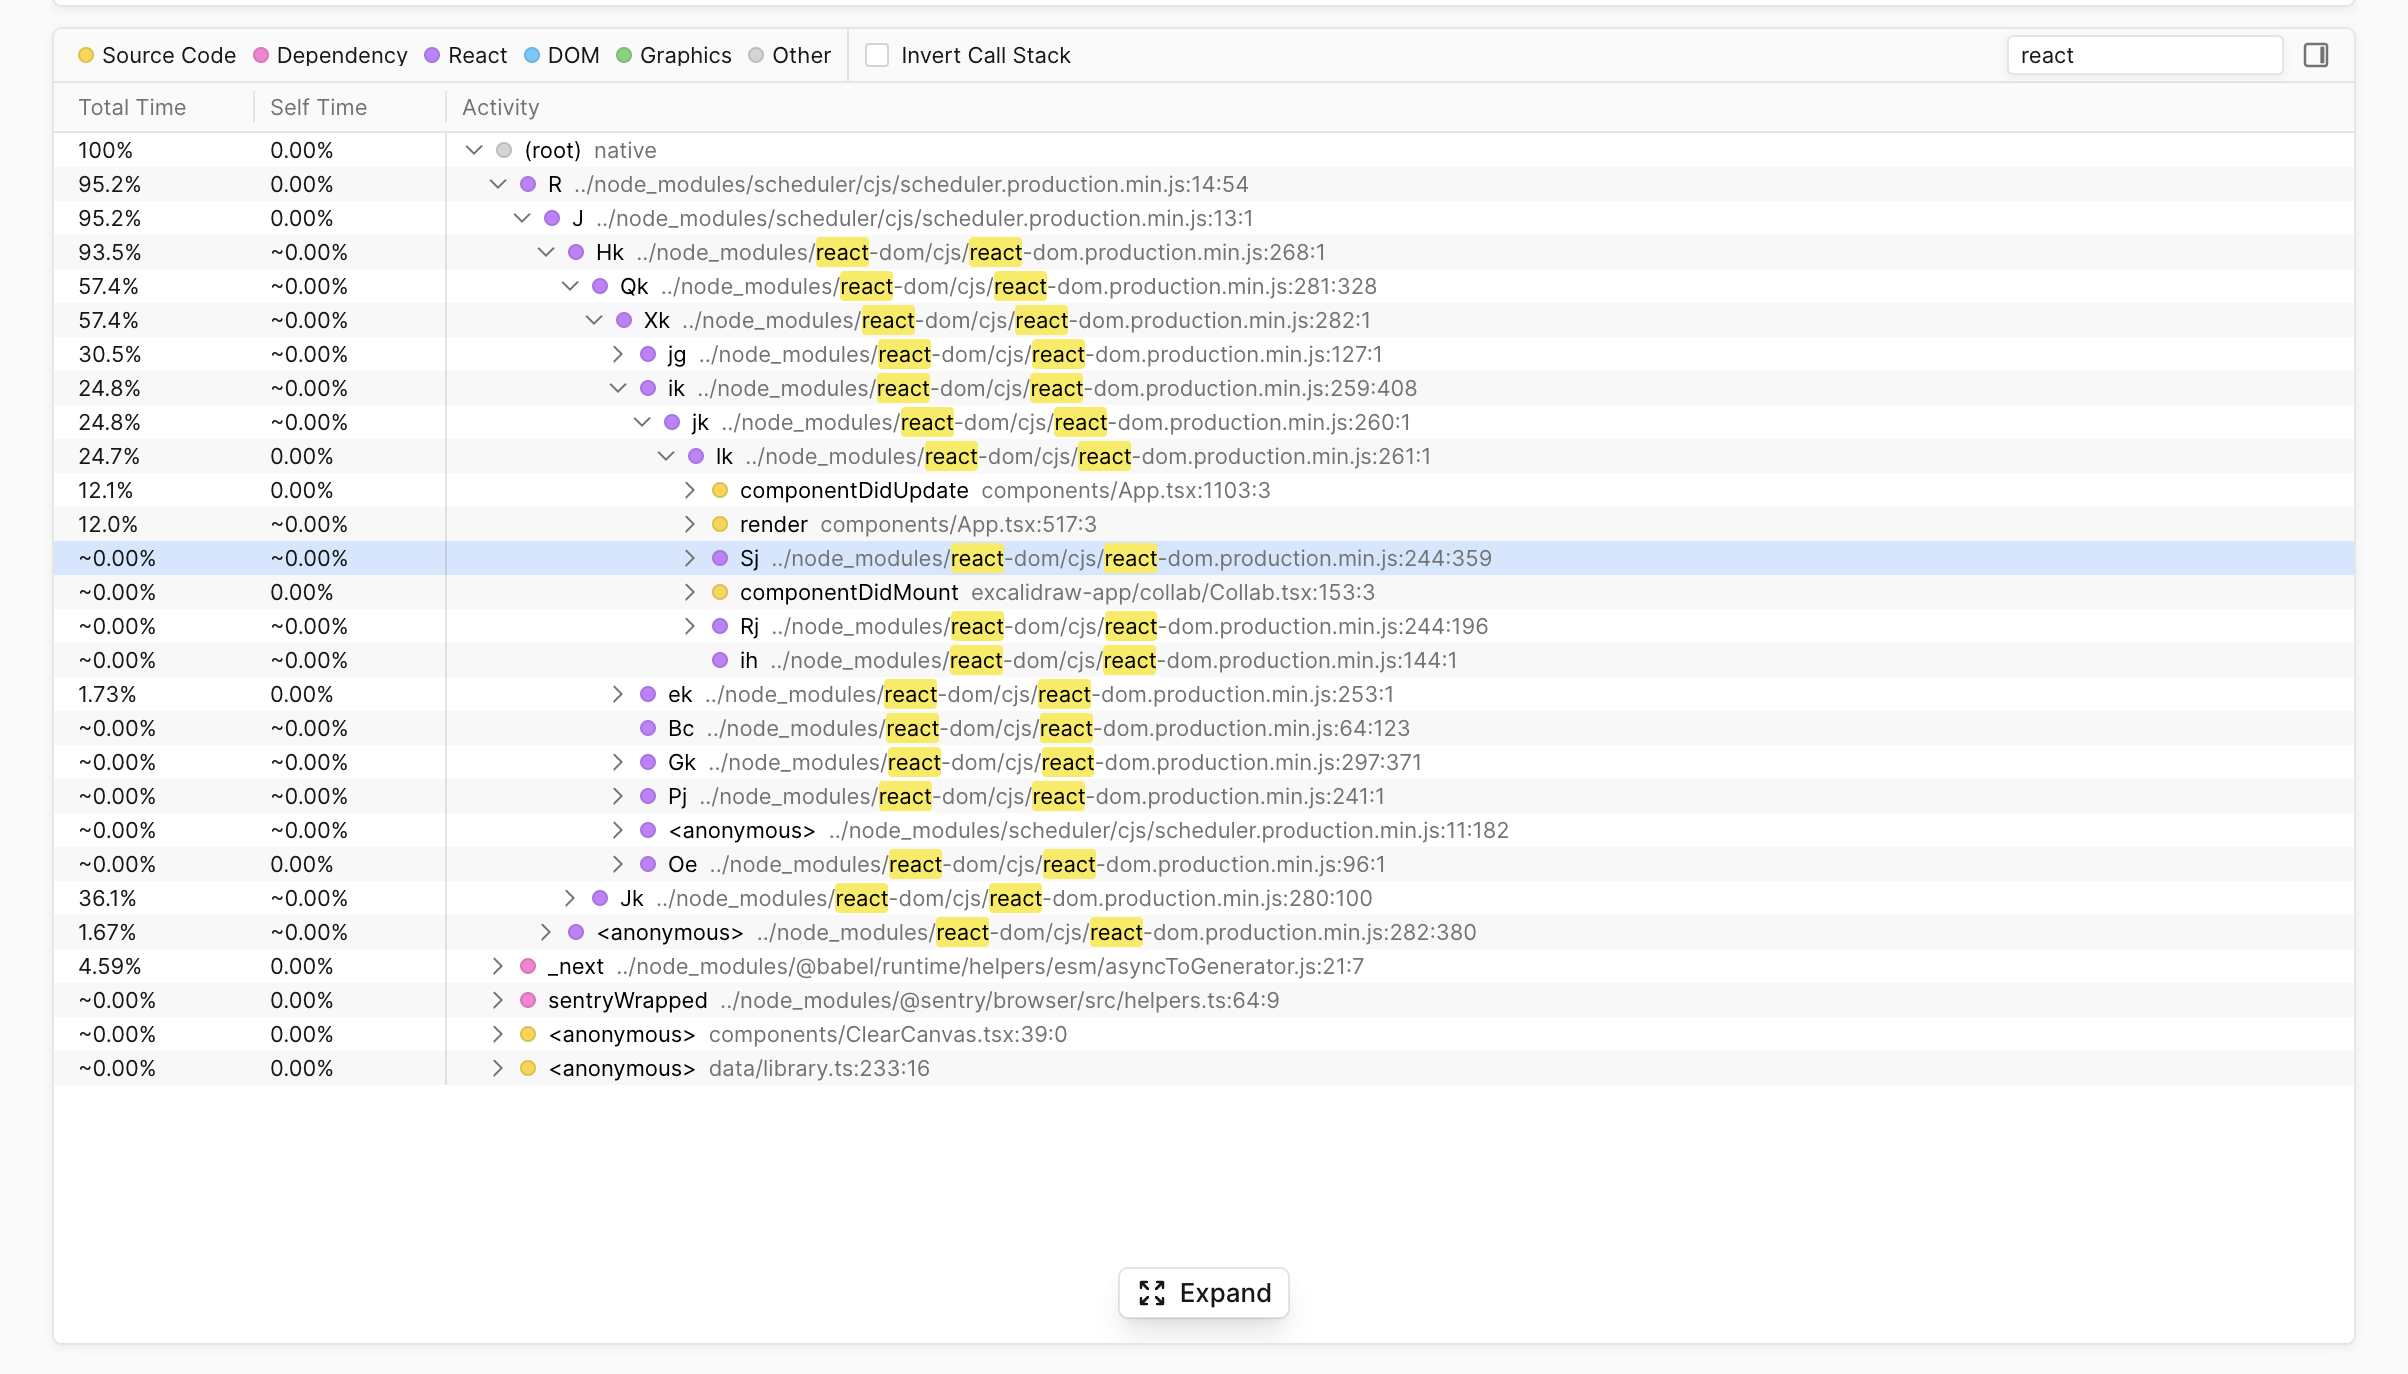
Inverting call stacks
Inverting the call stack changes the hierarchy. Instead of the function caller being the parent and the callee being the child, the callee is now the parent and the caller the child.
FAQs
Why doesn’t Palette show exact timings of functions?
When instrumenting your application using Palette, the sampling profiler does not collect exact function timings and consequently does not know when a function entered and exited the stack. The profiler works by sampling your application on an interval and collecting which functions are on the stack at that time.
As an example, consider the diagram below.
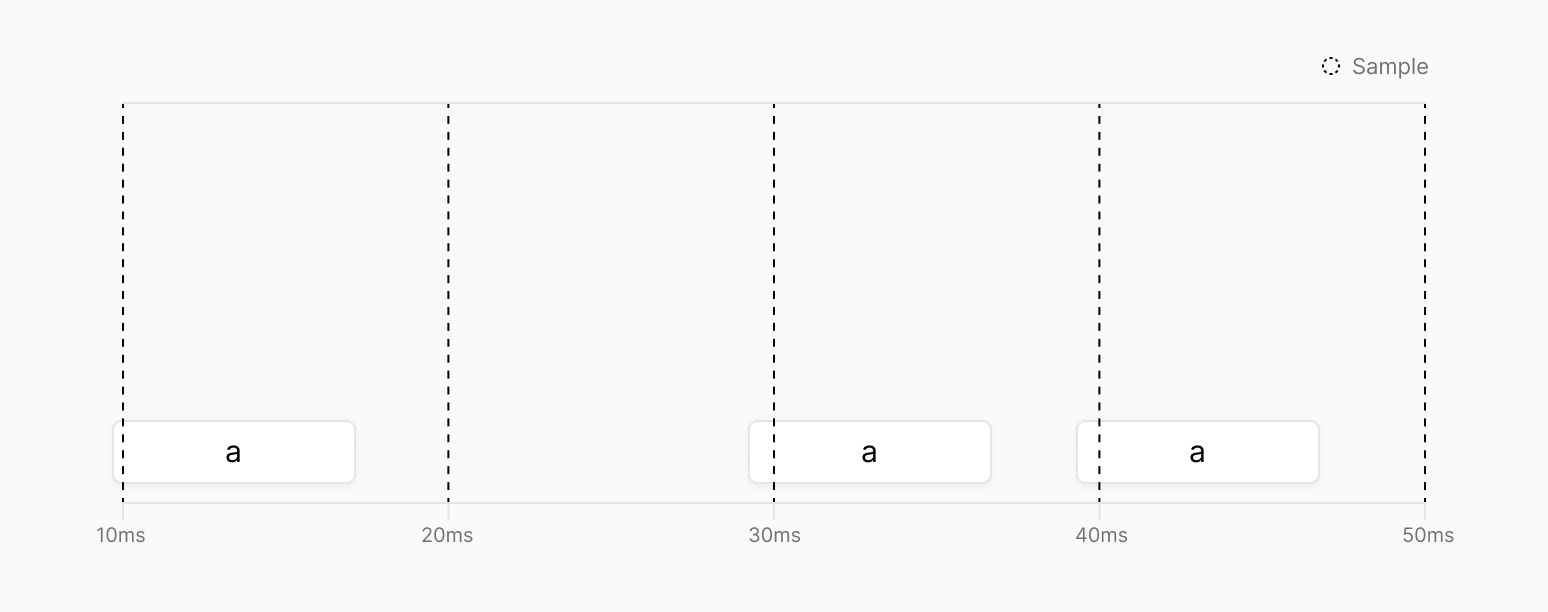
Palette cannot infer the duration of function a because the sampler only knows what function was on top of the stack, but not the function’s duration.