Sessions Overview
Sessions allow you to debug performance issues in end user experiences, similarly to how you would in a local development environment with the Chrome DevTools profiler.
There are two main ways to list sessions:
- Profile Sessions - Find sessions where a specific function was slow
- User Sessions - Find sessions based on a custom set of filters
Below is a walkthrough of finding a user session that had a slow longtask (aka jank):
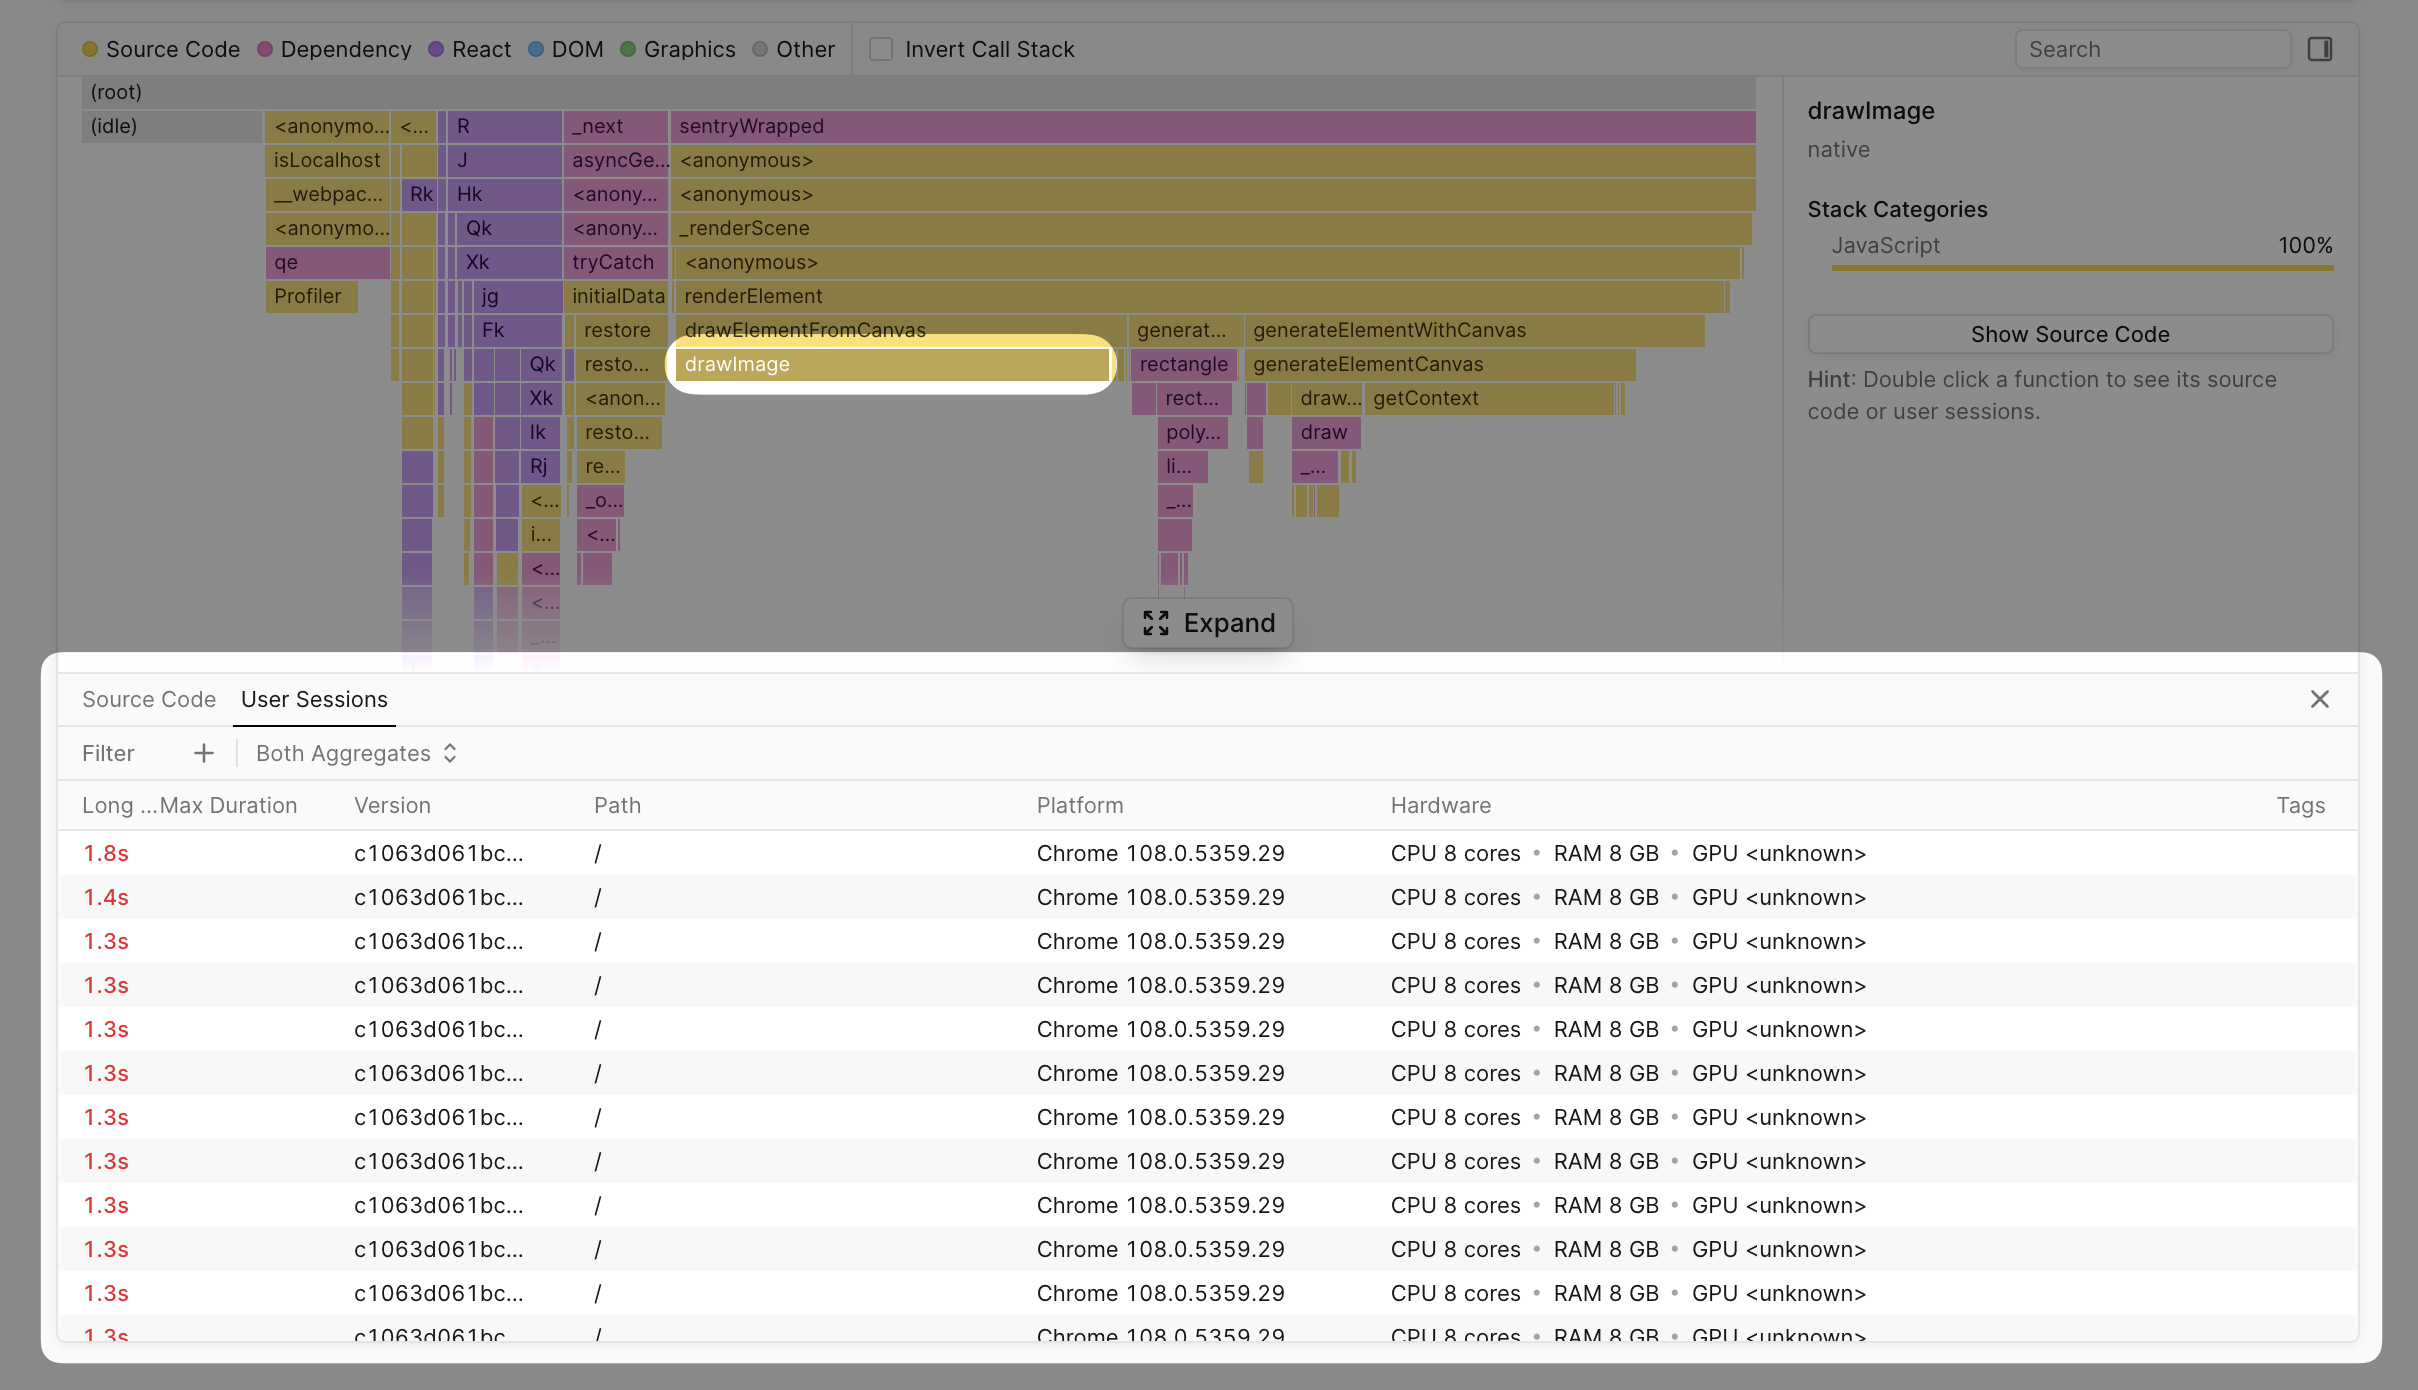
Profile Sessions
Profile sessions show you sessions where a specific function was being called often. For example, you can find sessions where the drawImage function was called often.
User Sessions
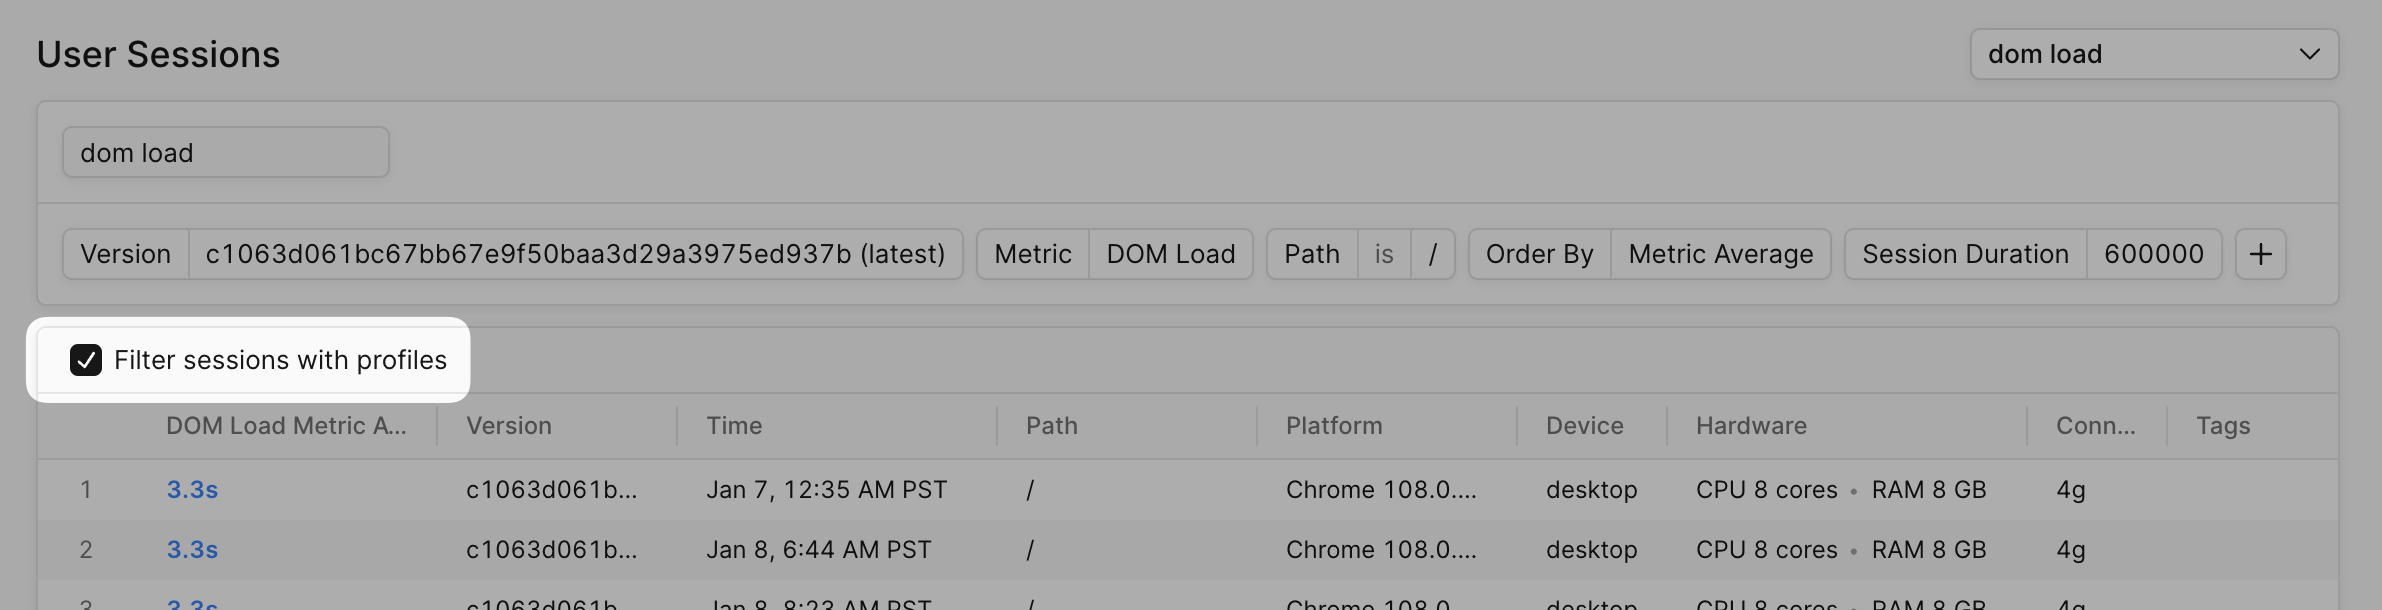
To find user sessions, start by creating a set of filters to query by. Refer to Profile Aggregates Filtering to learn more about required and optional fields.
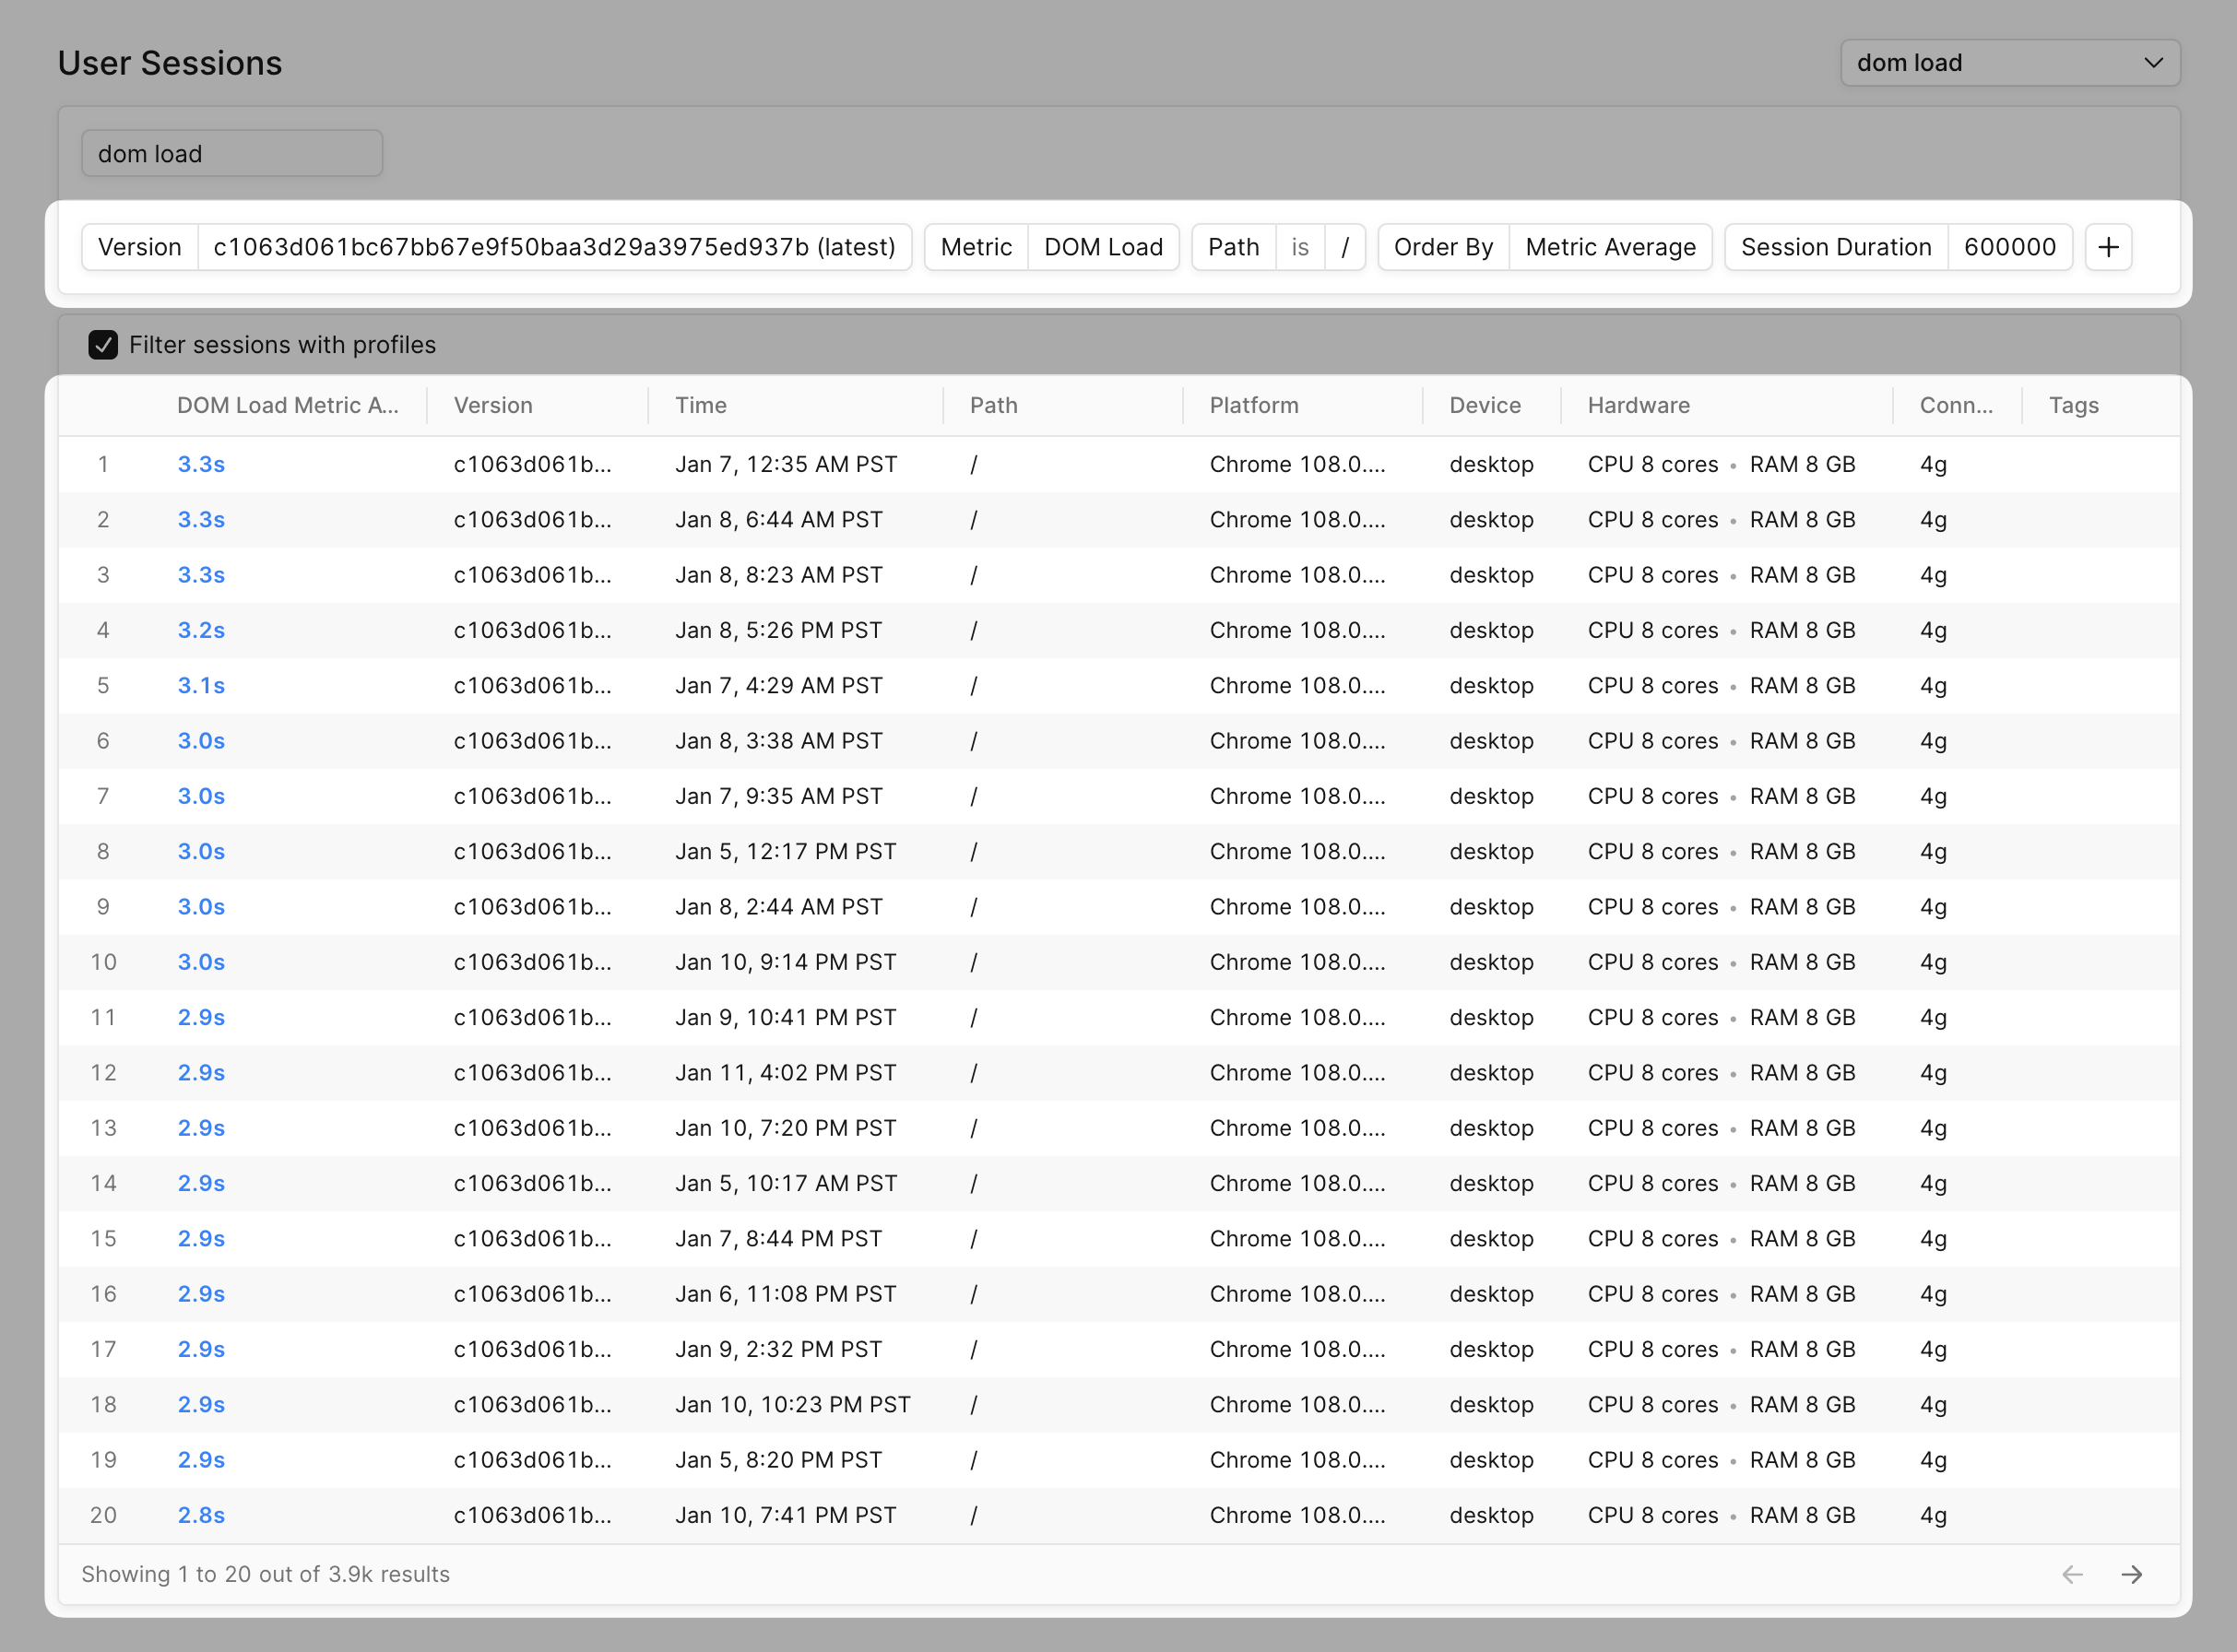
When selecting sessions, you'll often want to only see sessions that have profiles. You can achieve this by filtering by profiles: