Session Panels
Panels show detailed information about a session, such as network traces, markers, and call trees. They complement the Timeline, which provides an overview of a session's markers and profiles.
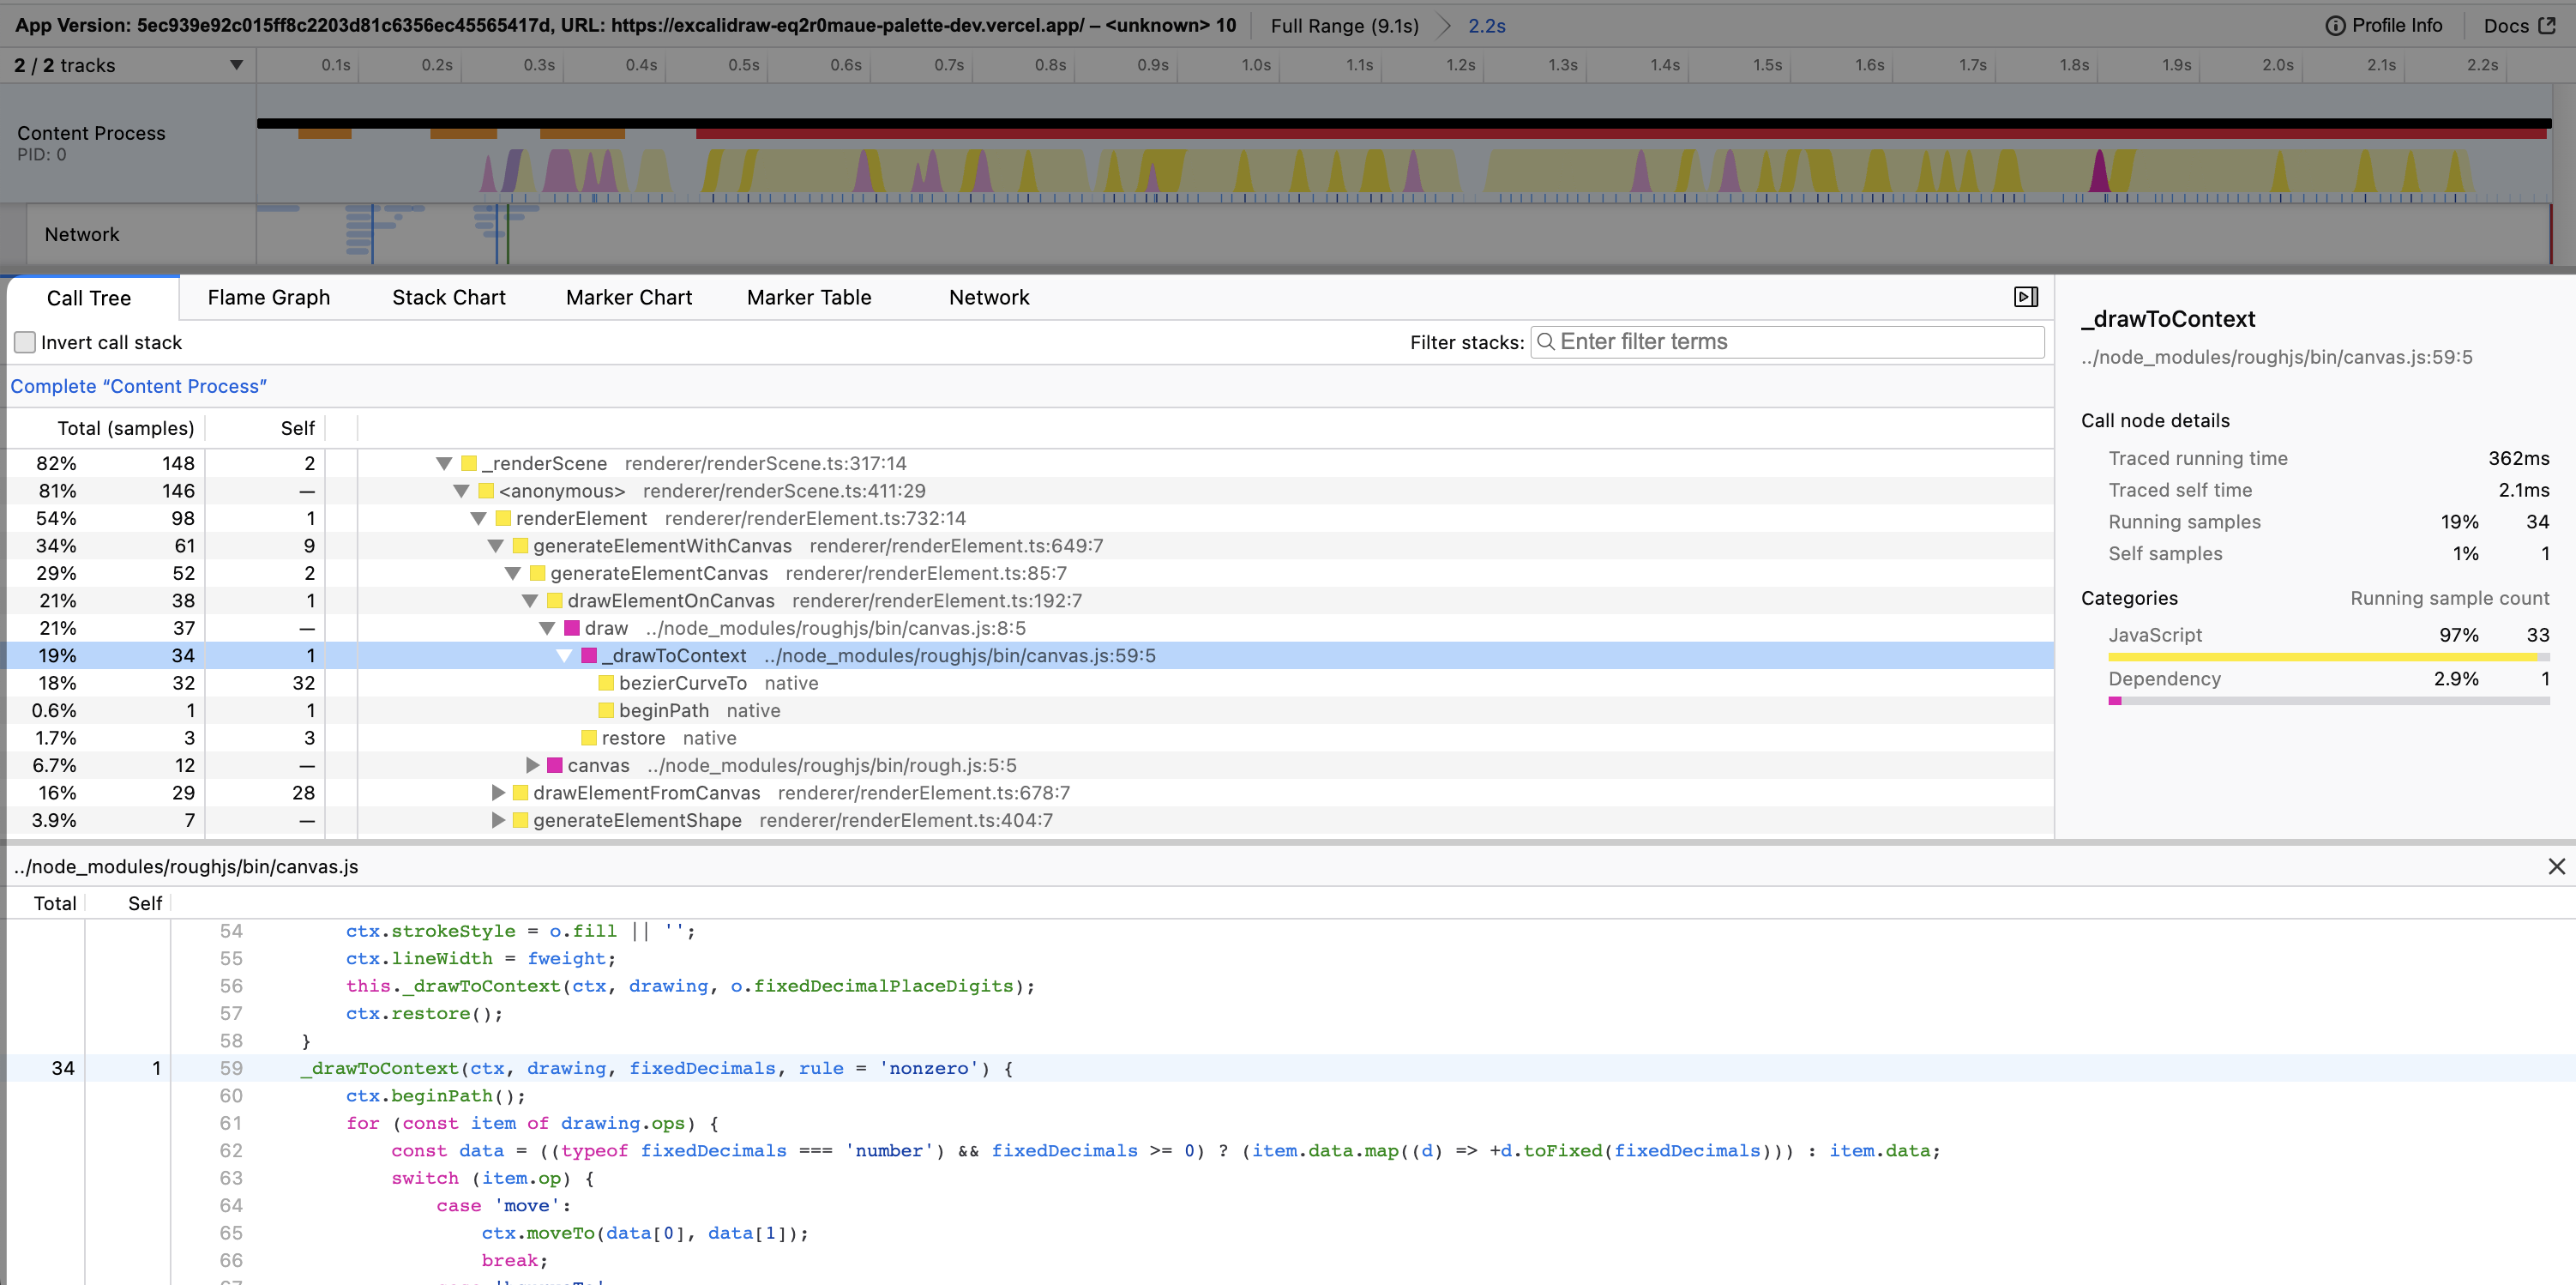
Call Tree
A Call Tree visualizes function execution as a list-hierarchy. Parent nodes represent functions that call another function, and the called function is represented as a child.
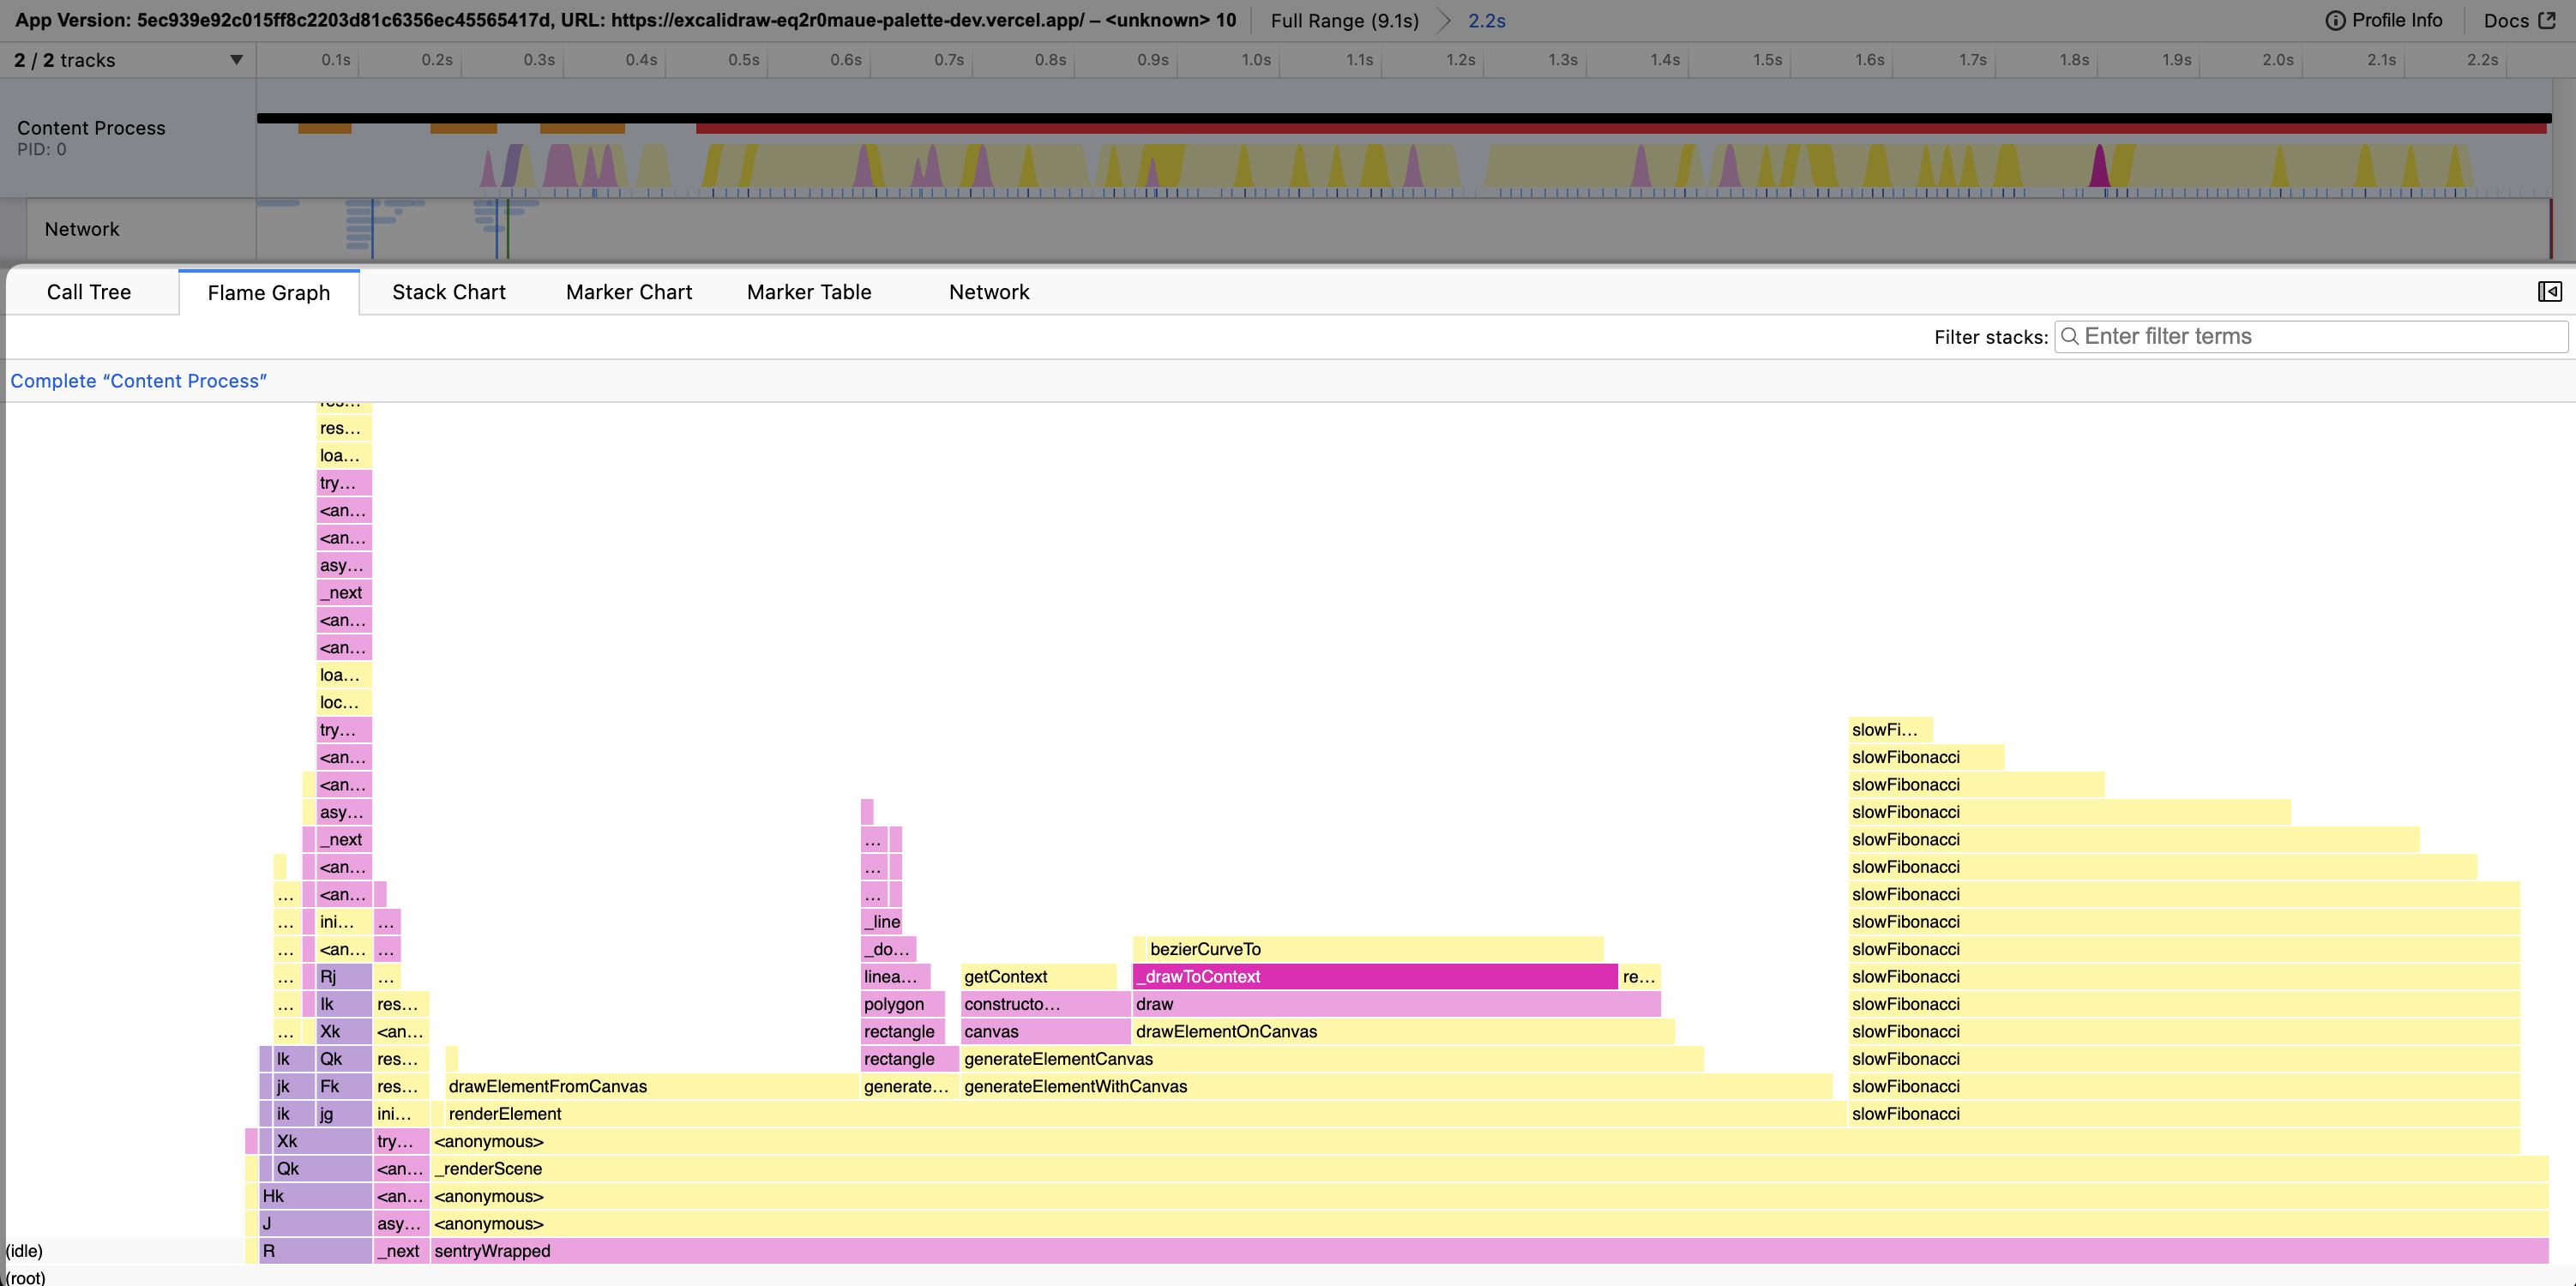
Flamegraph
The Flame Graph provides a more visual view into the same call tree structures:
- Larger rectangles indicate greater running time.
- The rectangles at the top are the stacks contributing to self time, where the program actually spends time.
- Functions are sorted alphabetically in ascending order from left to right.
Some users will prefer using the flame graph over the call tree because it's much more visual.
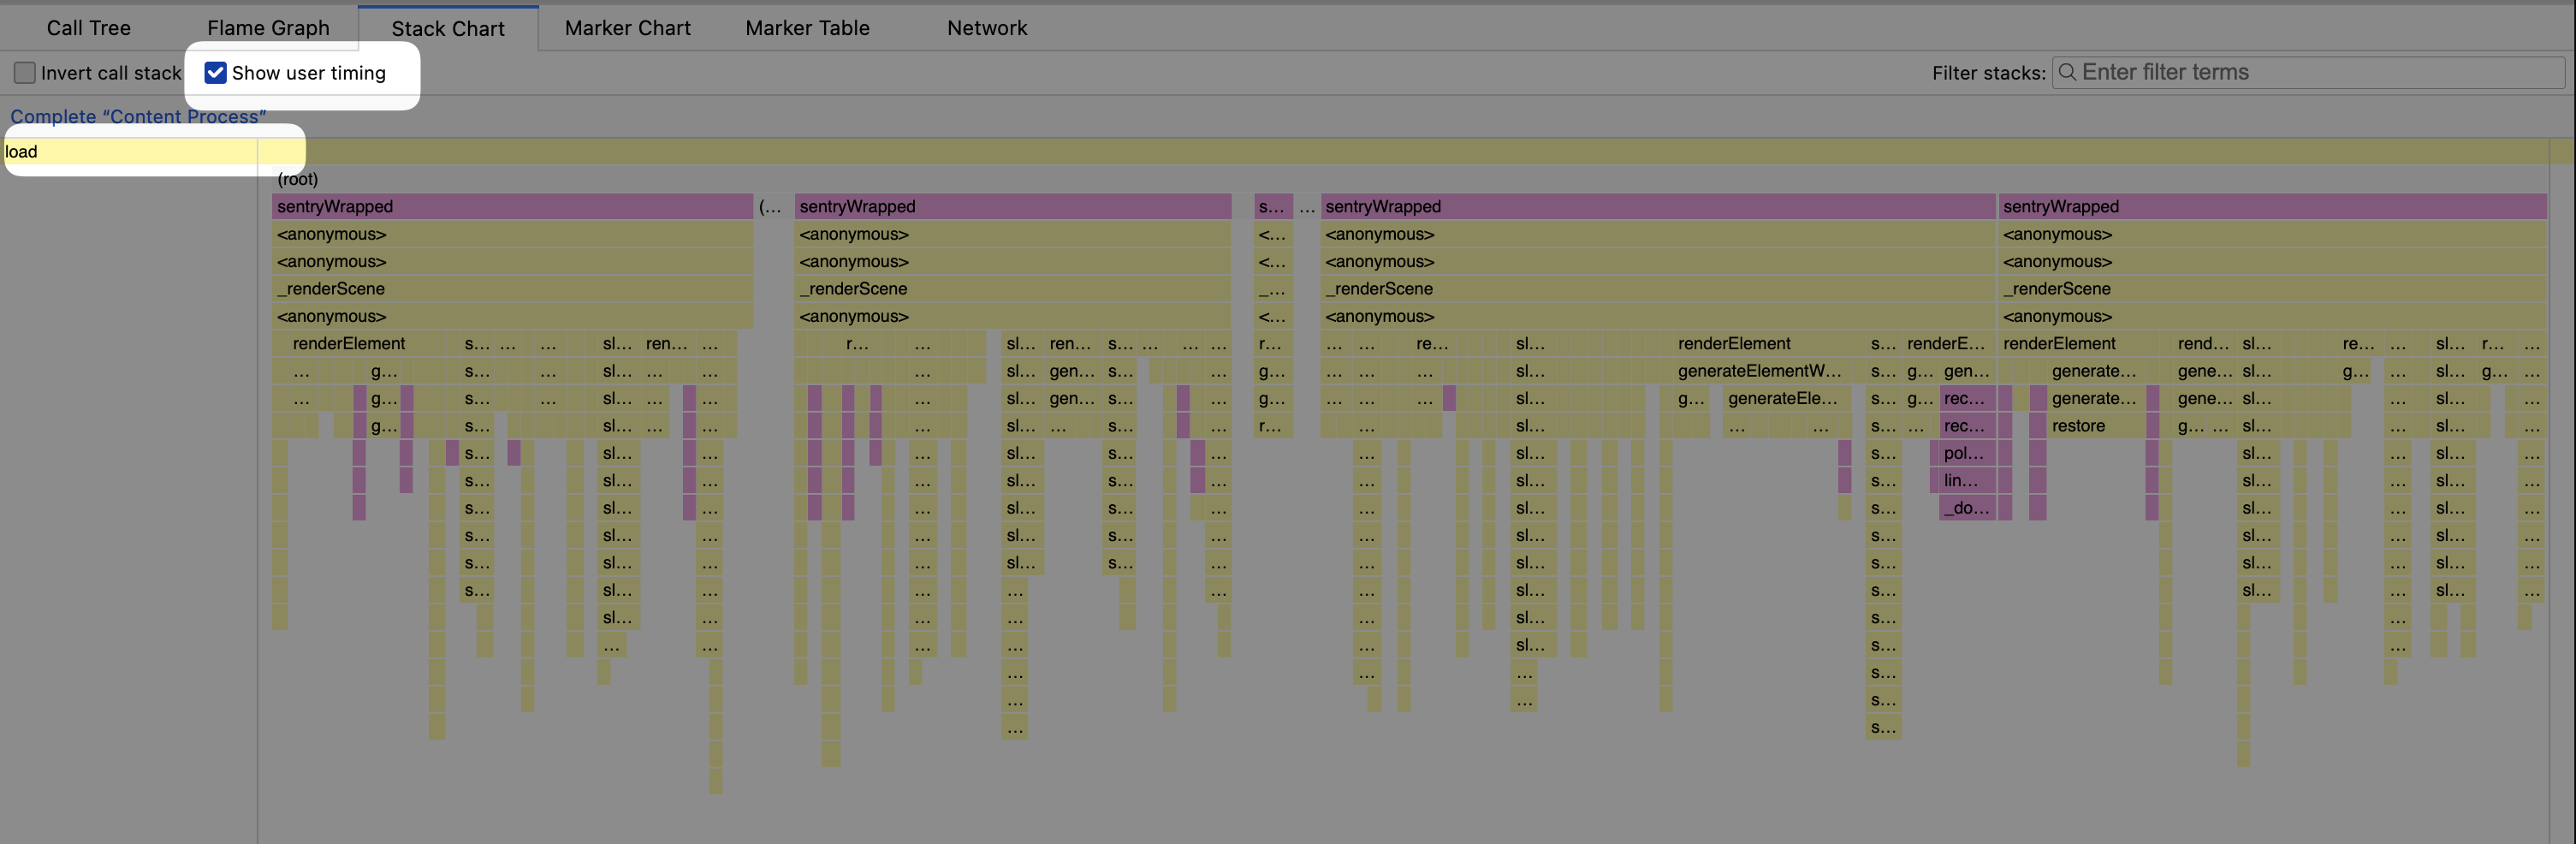
Stack Chart
The Stack Chart visualizes function execution with respect to time.
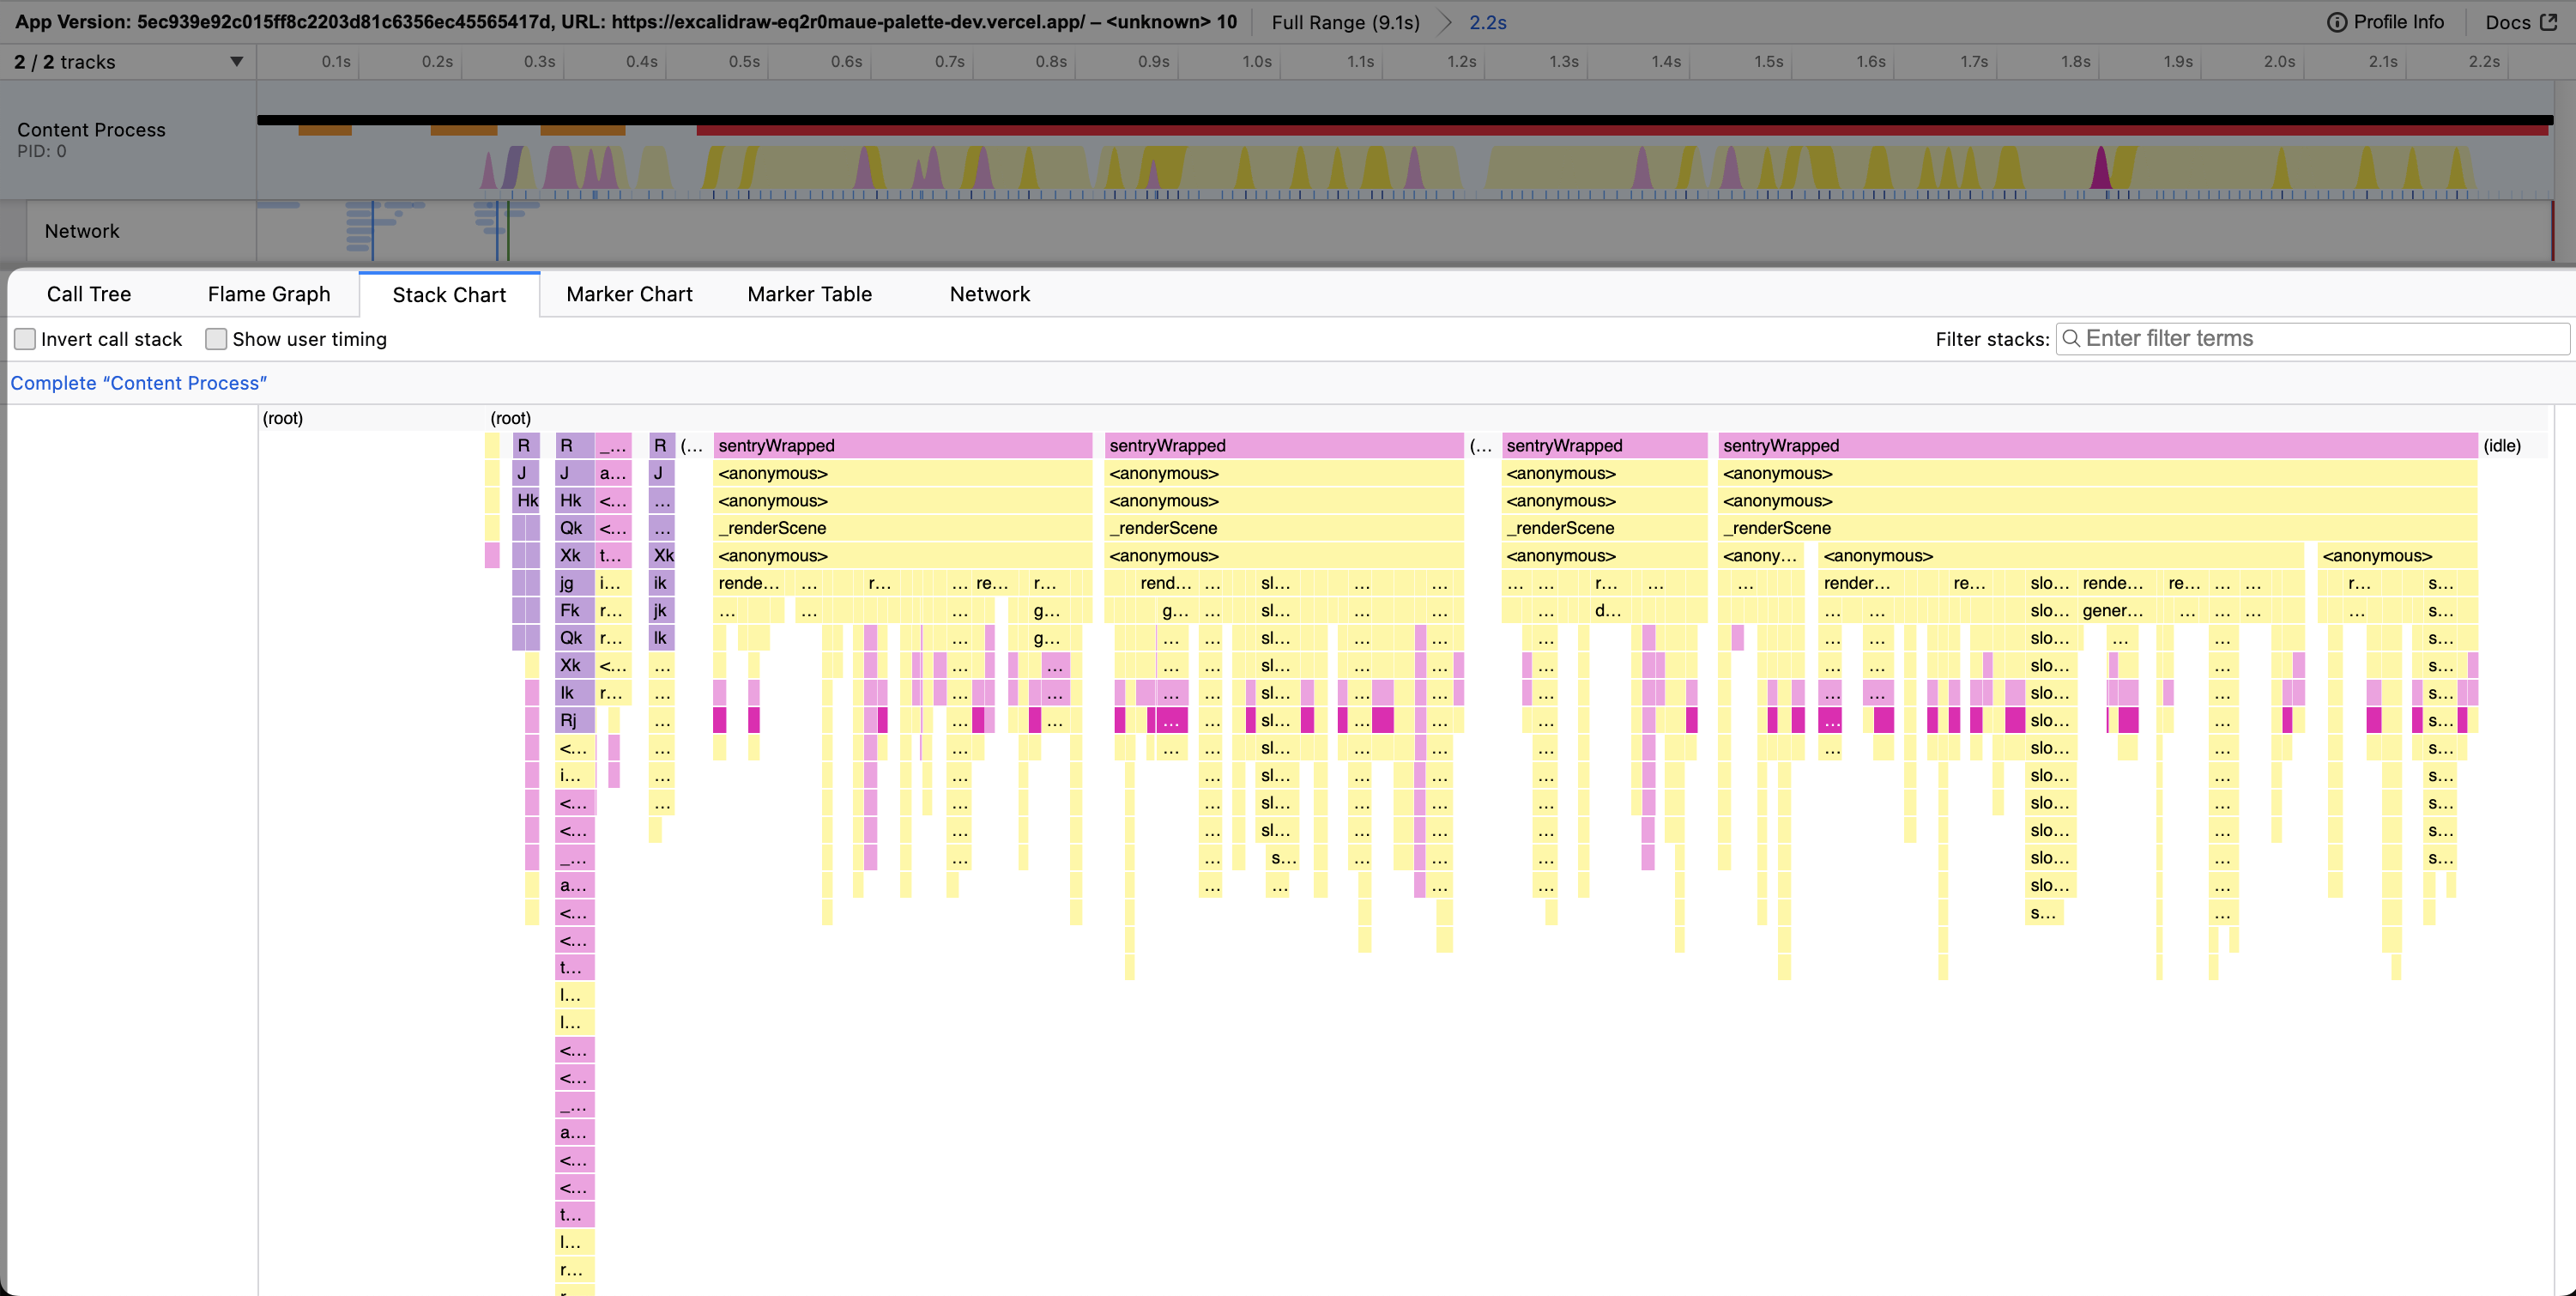
You can view markers inline with the stack chart by clicking "Show user timings":
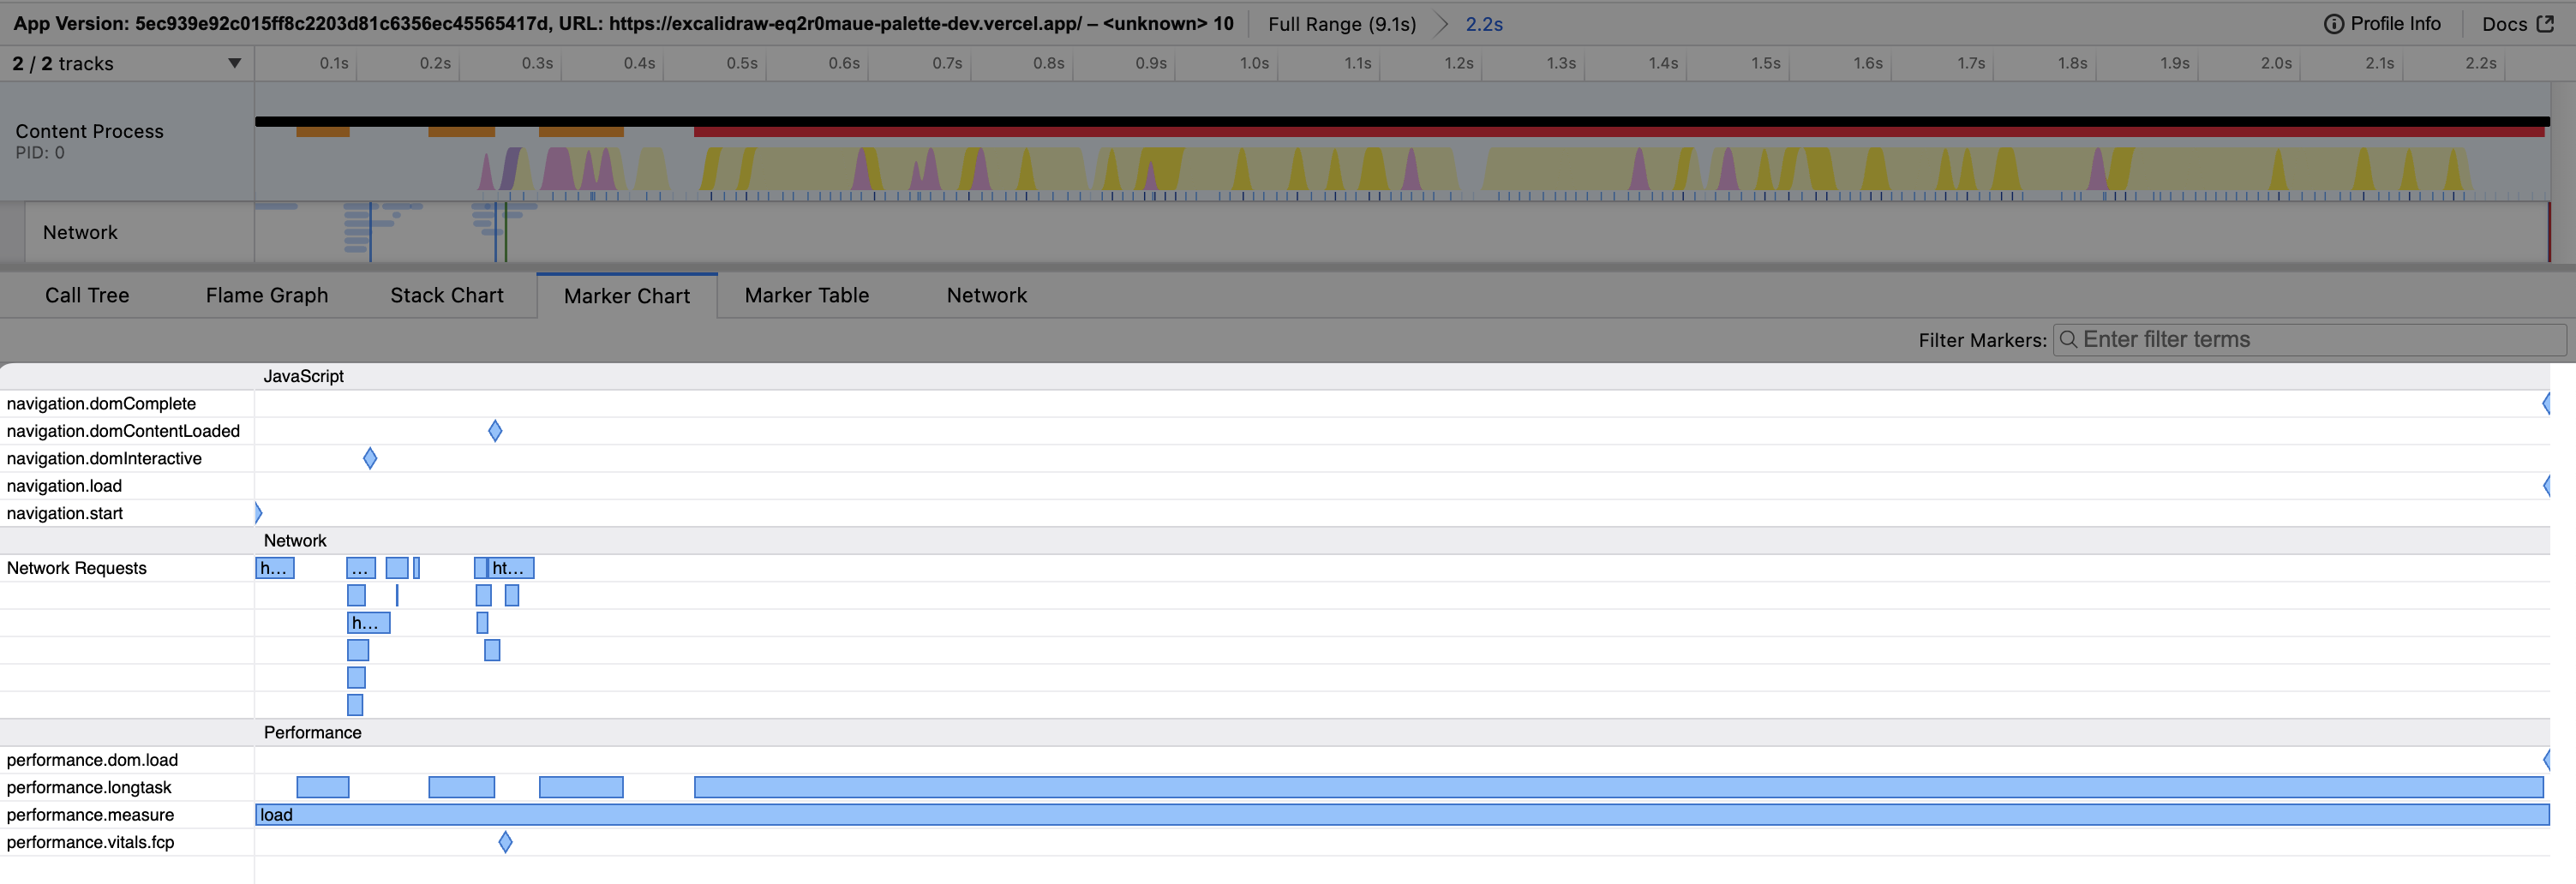
Marker Chart
The Marker Chart visualizes markers with respect to time. It shows the duration, name, and type of each marker.
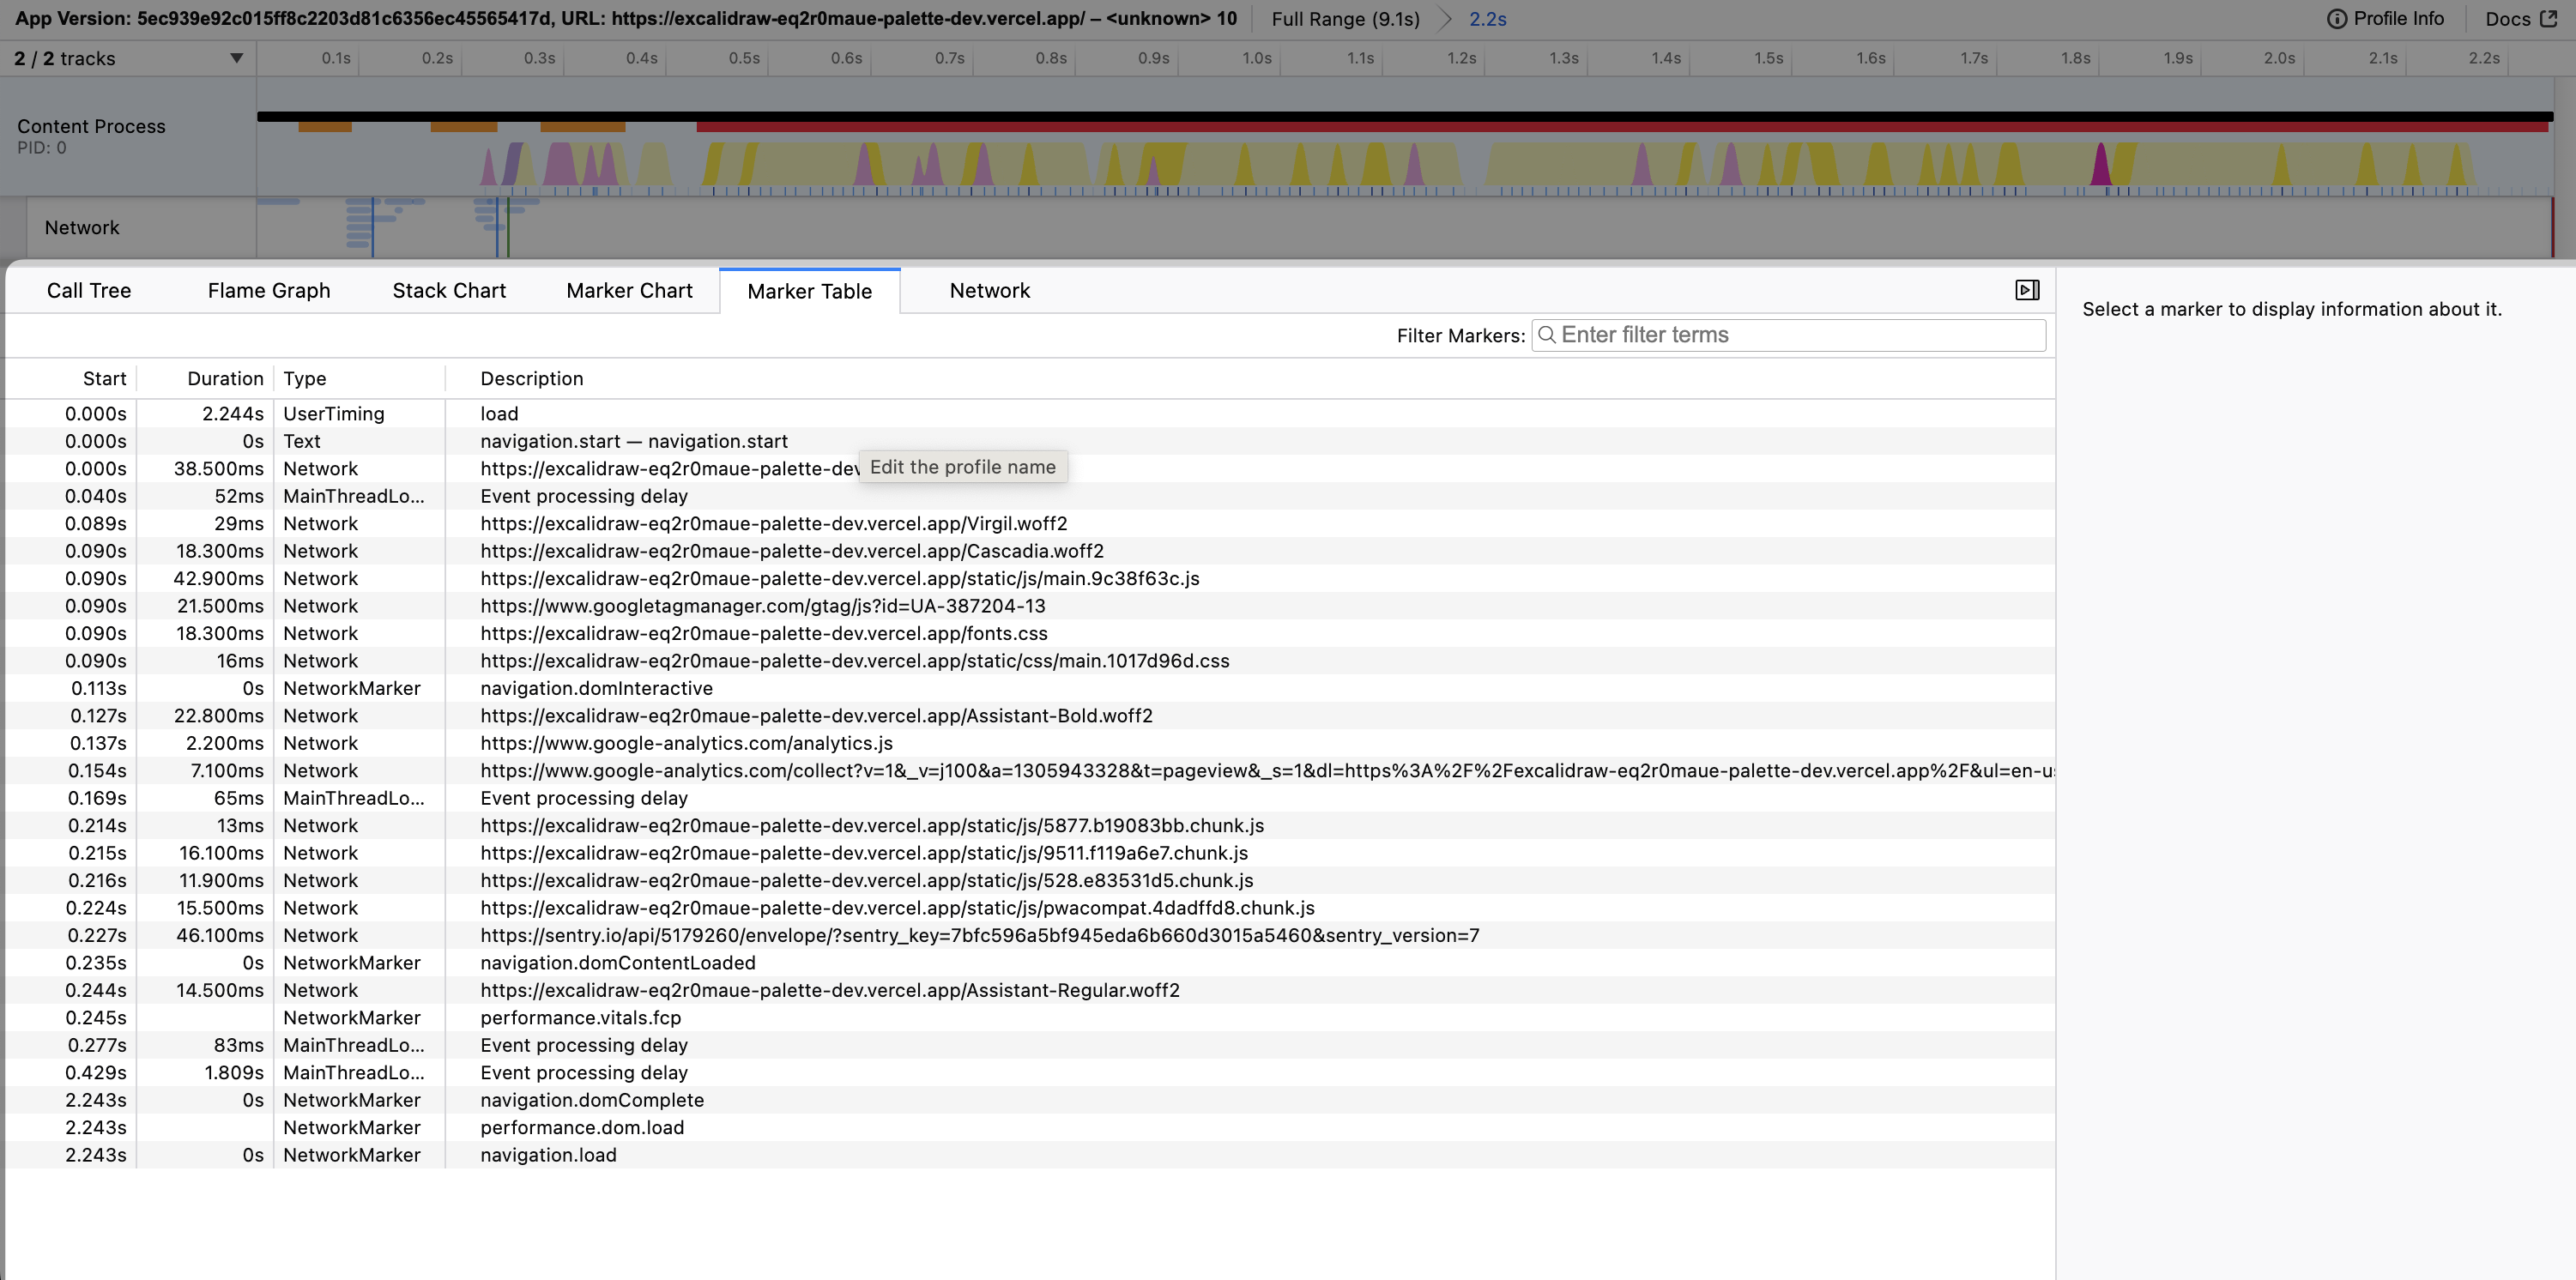
Marker Table
The Marker Table is a tabular view of markers. It shows the duration, name, and type of each marker.
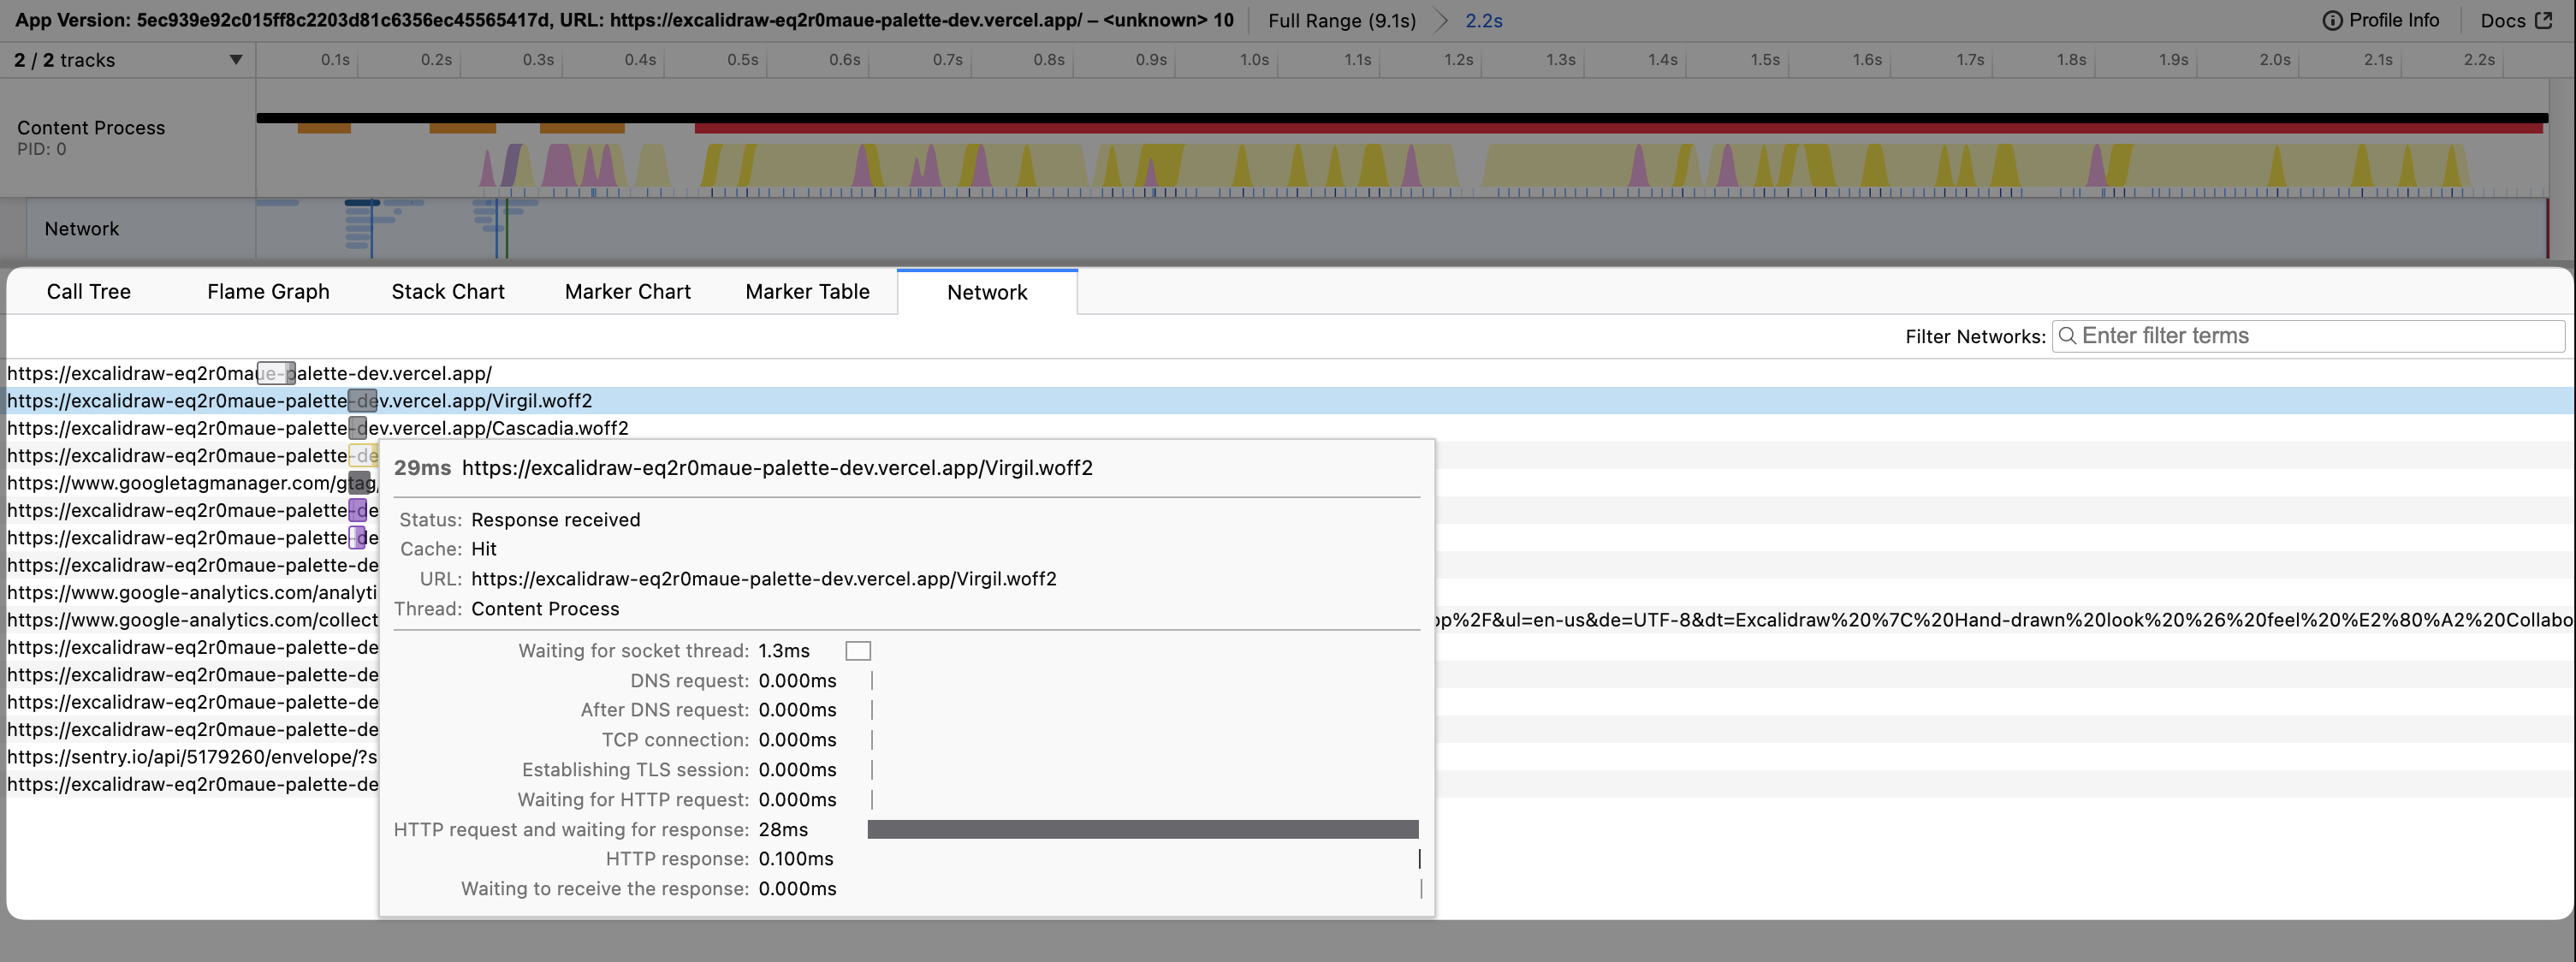
Network
The Network tab shows network requests made during the session. It shows information such as request url, cache hit/miss, duration, and DNS/TLS/TCP timings.