Leading the development of electron-react-boilerplate for over a decade has taught me a lot about bottlenecks in Electron apps and how to work around them. Properly engineered, Electron apps can closely rival the performance of native apps. This post is a complete guide on exploiting every Electron performance optimization I know so that you can get the most mileage.
Main Challenges with Electron Performance
Electron apps are often criticized for their performance, especially when compared to native apps. The main challenges with Electron performance are:
- Slow startup time
- Poor interaction performance
Below are approaches in Electron that will help you scale both the startup and interaction performance of Electron apps.
Strategies for Improving Performance
I've noted the following strategies as the most impactful performance improvements for Electron apps. These strategies are sorted in order of impact, the earlier ones are the most impactful
1. Use a Bundler, Avoid require()
The single biggest startup bottleneck in Electron apps is the require() function. It’s synchronous, recursive, and blocks both the main and renderer threads. Replacing it with a bundler (like Webpack, esbuild, or Vite) is non-negotiable for scaling startup performance.
Requiring a module involves the following steps:
- Resolving the module, as explained in Node’s documentation.
- Reading synchronously its contents.
- Compiling it.
- Executing it.
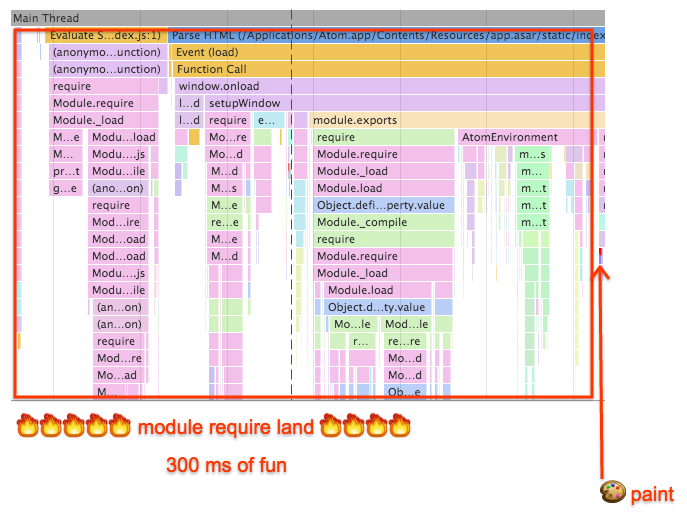
How require() Blocked the Main Thread in Atom
Sam Saccone, a performance engineer at Google, debugged Atom's startup performance, which was bottlenecked by require() calls. He found that the majority of the startup time was spent requiring modules and deadlocked in node.js execution before the initial paint in the browser was ever fired:
Most of the startup time is spent requiring modules and deadlocked in node.js execution before the initial paint in the browser is ever fired, resulting in slow feeling startup experience for end users, by potentially bundling all of the dependencies into one file there could be a sizeable perf savings.
One Bundle Per Electron Renderer Process
If your app has multiple renderer processes, you can use a single bundle for each renderer process. This reduces the number of bundles that need to be loaded and improves performance.
2. Defer Non-critical Imports
One way of reducing the upfront cost of loading your application is to use route-based code splitting and an app shell architecture. When consulting as an electron performance engineer, I've used route-based code splitting optimizations to bring down startup time from ~10sec to ~3sec.
Async Imports
You can also use async imports to load code only when it's needed. This is especially useful for large libraries that are not needed on every route. Webpack will automatically split the code into separate chunks and load them only when needed.
Async imports with React
import React, { lazy, Suspense } from "react";

const MyComponent = lazy(() => import("./MyComponent"));

function App() {
  return (
    <div>
      <Suspense fallback={<div>Loading...</div>}>
        <MyComponent />
      </Suspense>
    </div>
  );
}
This code will output two JavaScript assets (or chunks) being created by Webpack when properly configured with code splitting and dynamic imports:
- Main bundle (
main.js) – contains the App component and the logic to load MyComponent dynamically. - Lazy-loaded chunk (
MyComponent.[hash].js) – contains the code for./MyComponent.
Route-based Code Splitting
Building on async imports, route-based code splitting is a technique where you only load the code necessary for the current route. This is especially useful for large applications with many routes.
import React, { Suspense, lazy } from "react";
import { BrowserRouter as Router, Routes, Route } from "react-router-dom";

// Lazy load route components
const Home = lazy(() => import("./pages/Home"));
const About = lazy(() => import("./pages/About"));
const Contact = lazy(() => import("./pages/Contact"));

function App() {
  return (
    <Router>
      <Suspense fallback={<div>Loading...</div>}>
        <Routes>
          <Route path="/" element={<Home />} />
          <Route path="/about" element={<About />} />
          <Route path="/contact" element={<Contact />} />
        </Routes>
      </Suspense>
    </Router>
  );
}

export default App;
As before, Webpack will generate:
- Main bundle (
main.js) – contains the App component and the logic to load the route components dynamically. - Lazy-loaded chunk for each page (
Home.[hash].js,About.[hash].js,Contact.[hash].js)
3. Migrate Computationally Expensive Workloads to WebAssembly or Native Modules
If your app often performs computationally expensive tasks, it's likely a good move to run those tasks in WebAssembly. Rather than the JavaScript engine having to execute and then optimize code at runtime, WASM executables are optimized ahead of time and therefore provide better and deterministic performance.
Real-World Use:
- Notion compiled SQLite to WebAssembly and uses it to quickly store and query documents.
- Figma is completely written in WebAssembly.
- Signal (the end to end encrypted messaging app) uses WebAssembly for its cryptography library.
- 1Password uses Node native modules for encrypting passwords.
4. Use V8 Snapshots to Reduce Initialization Time
V8 snapshots allow passing V8 a pre-initialized heap of all your dependencies. The V8 team wrote a great article on V8 Snapshots, which I highly recommend reading. Use electron-link to create JS module that can be snapshotted by V8. Leverage snapshotting in both the main and renderer process bundles to get the most out of snapshotting.
Here are the general steps to create a V8 snapshot:
- Use electron-link to create a JS module that can be snapshotted by V8.
- Use
mksnapshotto create a snapshot - Load the snapshot in your Electron app using the
--snapshot-blobflag.
To see the full process, check out this guide.
Limitations and Recommendations for V8 Snapshots
- Snapshots must not contain dynamic values (e.g., Date.now, Math.random, etc.).
- Avoid file I/O or API calls in snapshot code.
- Snapshots work best for shared global initializations or framework bootstrapping.
How the Atom Team Used V8 Snapshots
The Atom team reduced startup time by 50% by using V8 snapshots.
Overall, on a stock installation, we made loading Atom almost 50% faster and snapshots were a crucial tool that enabled some otherwise impossible optimizations.
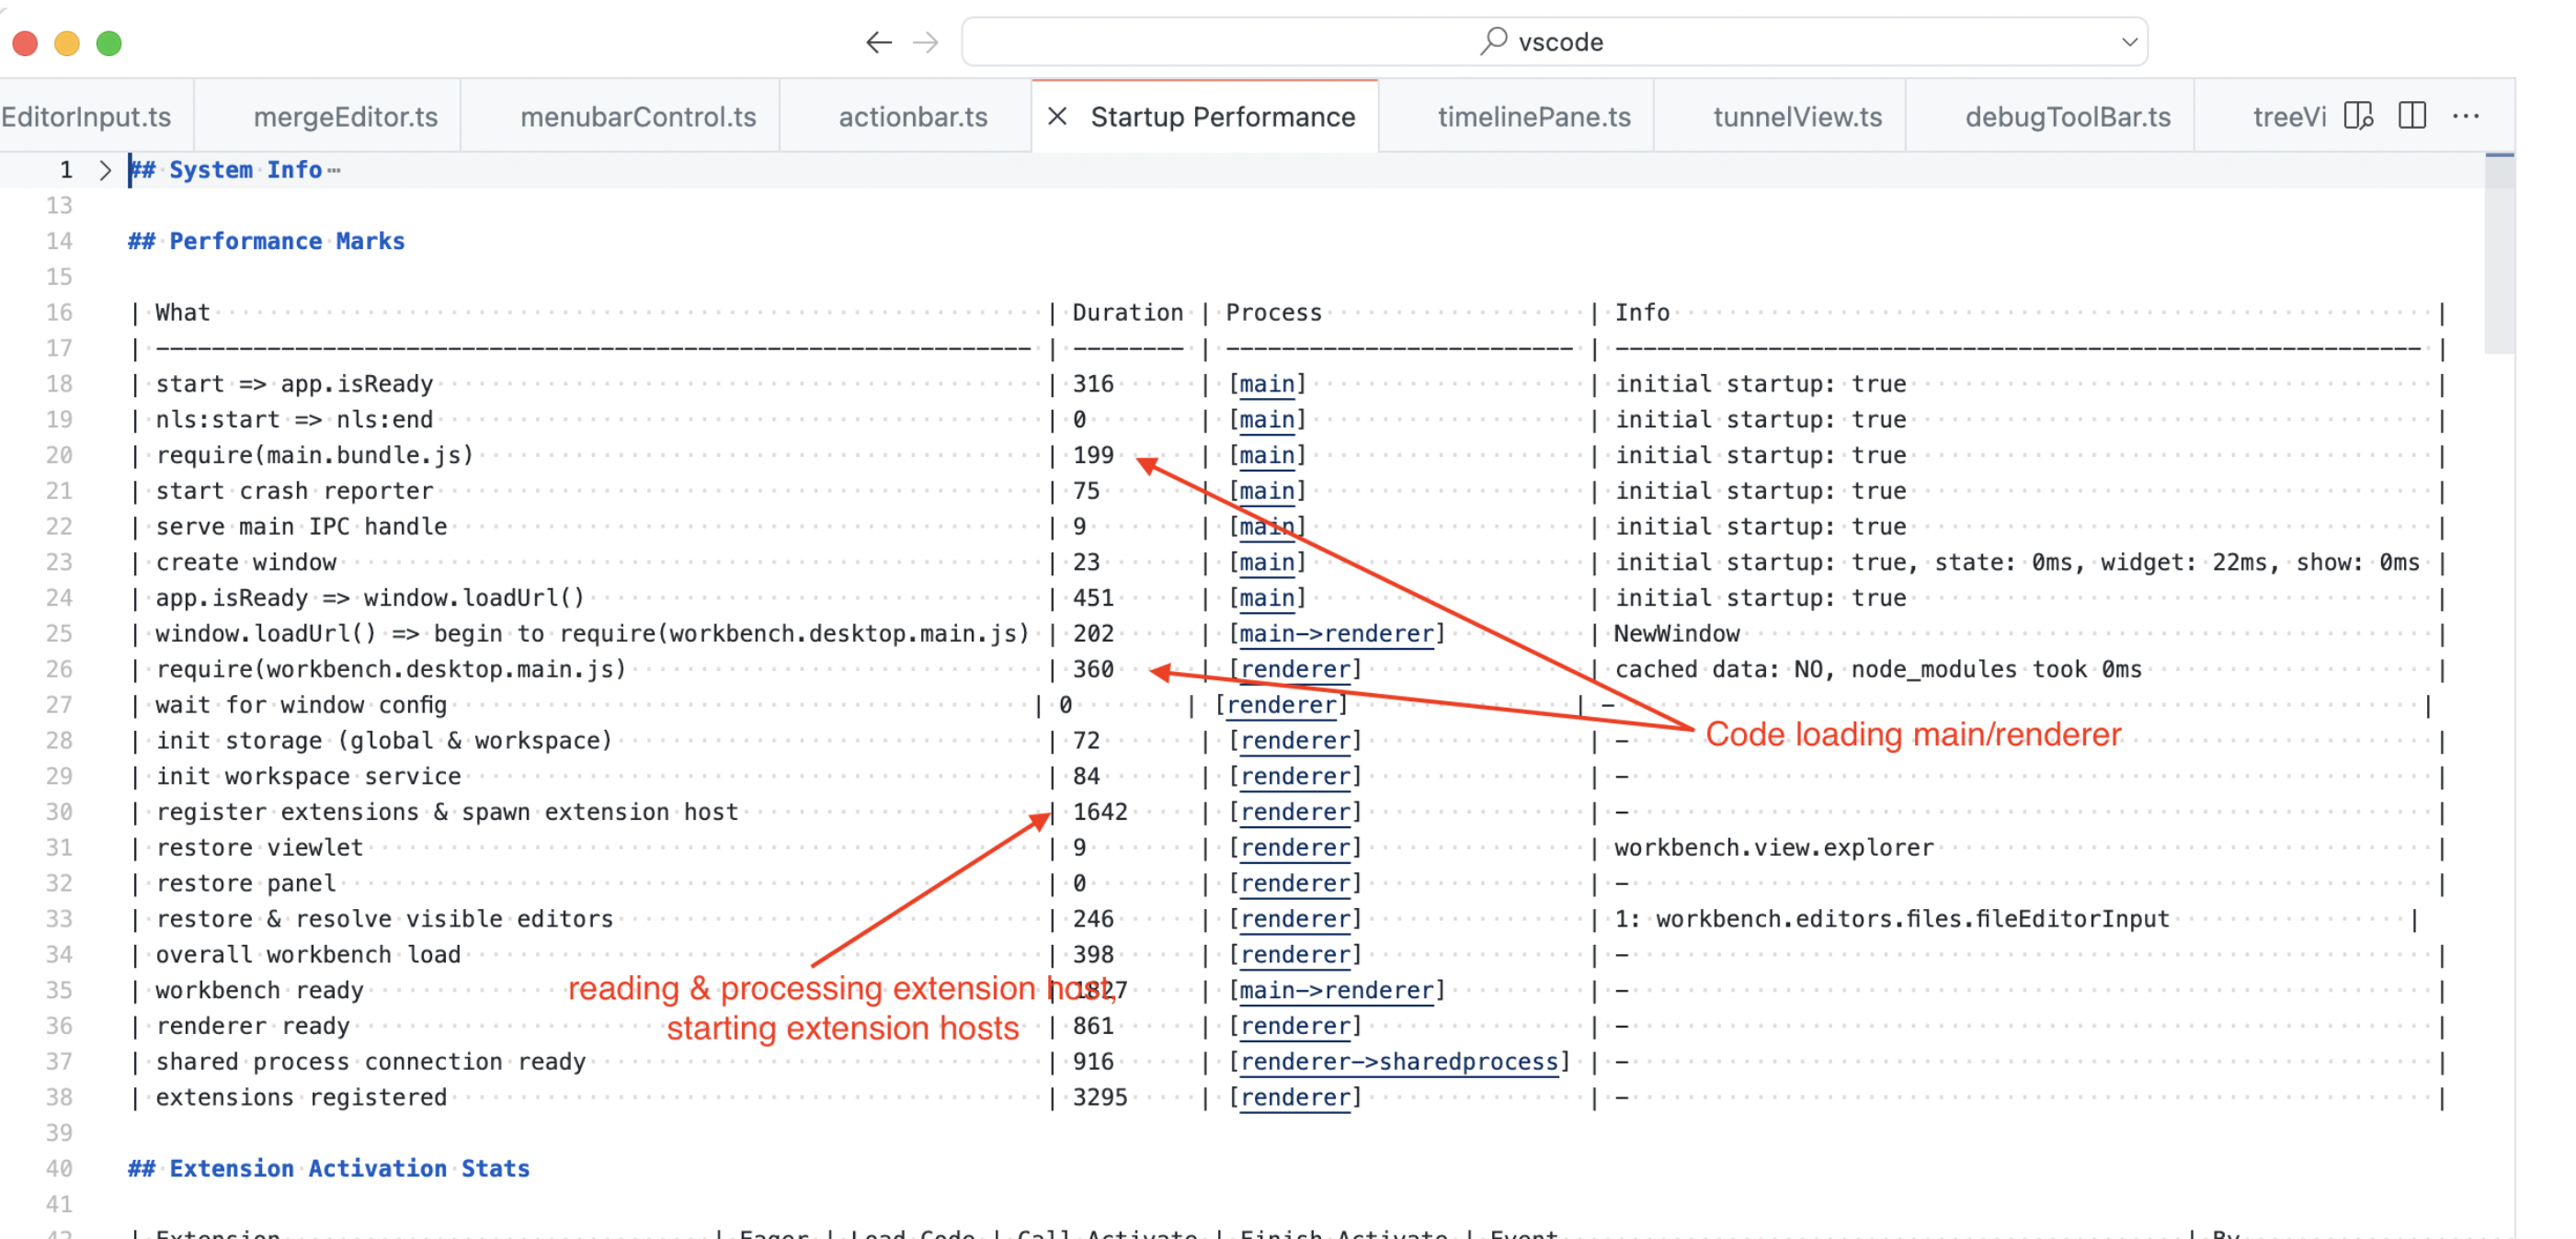
The VSCode team also uses V8 snapshots to improve startup performance since 2017.
5. Monitor End User Performance in Production
Completely relying on end users to report performance issues is a brittle strategy. Most users don't take the time to report performance issues, which means most performance issues are unreported.
You can't improve what you don't measure. The first step to improving performance in production is measuring it.
Perceived Performance Metrics
The most valuable metrics to collect are the ones that are closest to measuring the user's perceived performance. And while Web Vitals are the web's standard performance metrics, they run short on measuring what's often slow in Electron apps -- interaction performance.
Here are some examples of perceived interaction performance metrics that you can collect:
- Click latency: Time between when a user clicks on a button and when the browser shows a visual update.
- Keypress latency: Time between when a user presses a key and when the browser shows a visual update.
- Scroll latency: Time between when a user scrolls and when the browser shows a visual update.
- Time to feature paint: Time between when app initializes and when a particular feature is rendered on the screen.
You can measure these metrics using the PerformanceObserver API and the Long Tasks API. The PerformanceObserver API allows you to observe performance events, while the Long Tasks API allows you to measure long tasks that block the main thread.
Here's an example of how to use the PerformanceObserver API to measure click latency:
performance.mark("react.render.start"); // Start measuring
React.render(<App />, document.getElementById("app")); // Measure some expensive work
performance.measure("react.render.total", "react.render.start"); // Stop measuring
How Slack Collects Performance Metrics in Production
By digging into Slack's compiled code, I found a performance utilities object they wrote that collects several performance metrics:
{
  defaultTraceCategories: [],
  performance: {
    enable: () => {},
    disable: () => {},
    getMetrics: () => {},
    timeToPageLoad: () => {},
    timeSpentInPreload: () => {},
  },
  restartWithNetLog: () => {},
  startNetLog: () => {},
  clearCache: () => {},
  getCPUUsage: () => {},
  getMemoryUsage: () => {},
  getAppMetrics: () => {},
  startTraceRecord: () => {},
  stopTraceRecord: () => {},
  getDOMCounters: () => {},
}
How the VSCode Team Monitors Performance
As an example, the VSCode team measures the input latency to catch regressions to typing performance between releases.
6. End User JavaScript Profiling in Electron
Profiling frontend code running for end users, a technique pioneered by Facebook in 2021, is an increasingly common technique for understanding application performance at a deeper level. This technique has since been adopted by many other companies building large web apps, including Microsoft, Dropbox, Slack, Notion, and others. This isn't a surprise because web apps, whose performance is usually bound by JavaScript execution, benefit the most from code-level visibility production profiling lends.
Production profiling goes a step beyond local Chrome DevTools profiling by allowing you to answer more advanced performance questions:
- Which functions are impacting end users with the slowest typing performance the most?
- Which functions regressed end user click performance after the last release?
- Which functions are blocking the p95 of page initialization for end users?
At Palette, we're building a purpose-built performance monitoring platform specifically for web and Electron apps. In addition to collecting the metrics mentioned above, we also collect the following metrics:
It goes a step further by tying profiling data to performance metrics, allowing you to see exactly which functions are impacting the p95 click latency, for example.
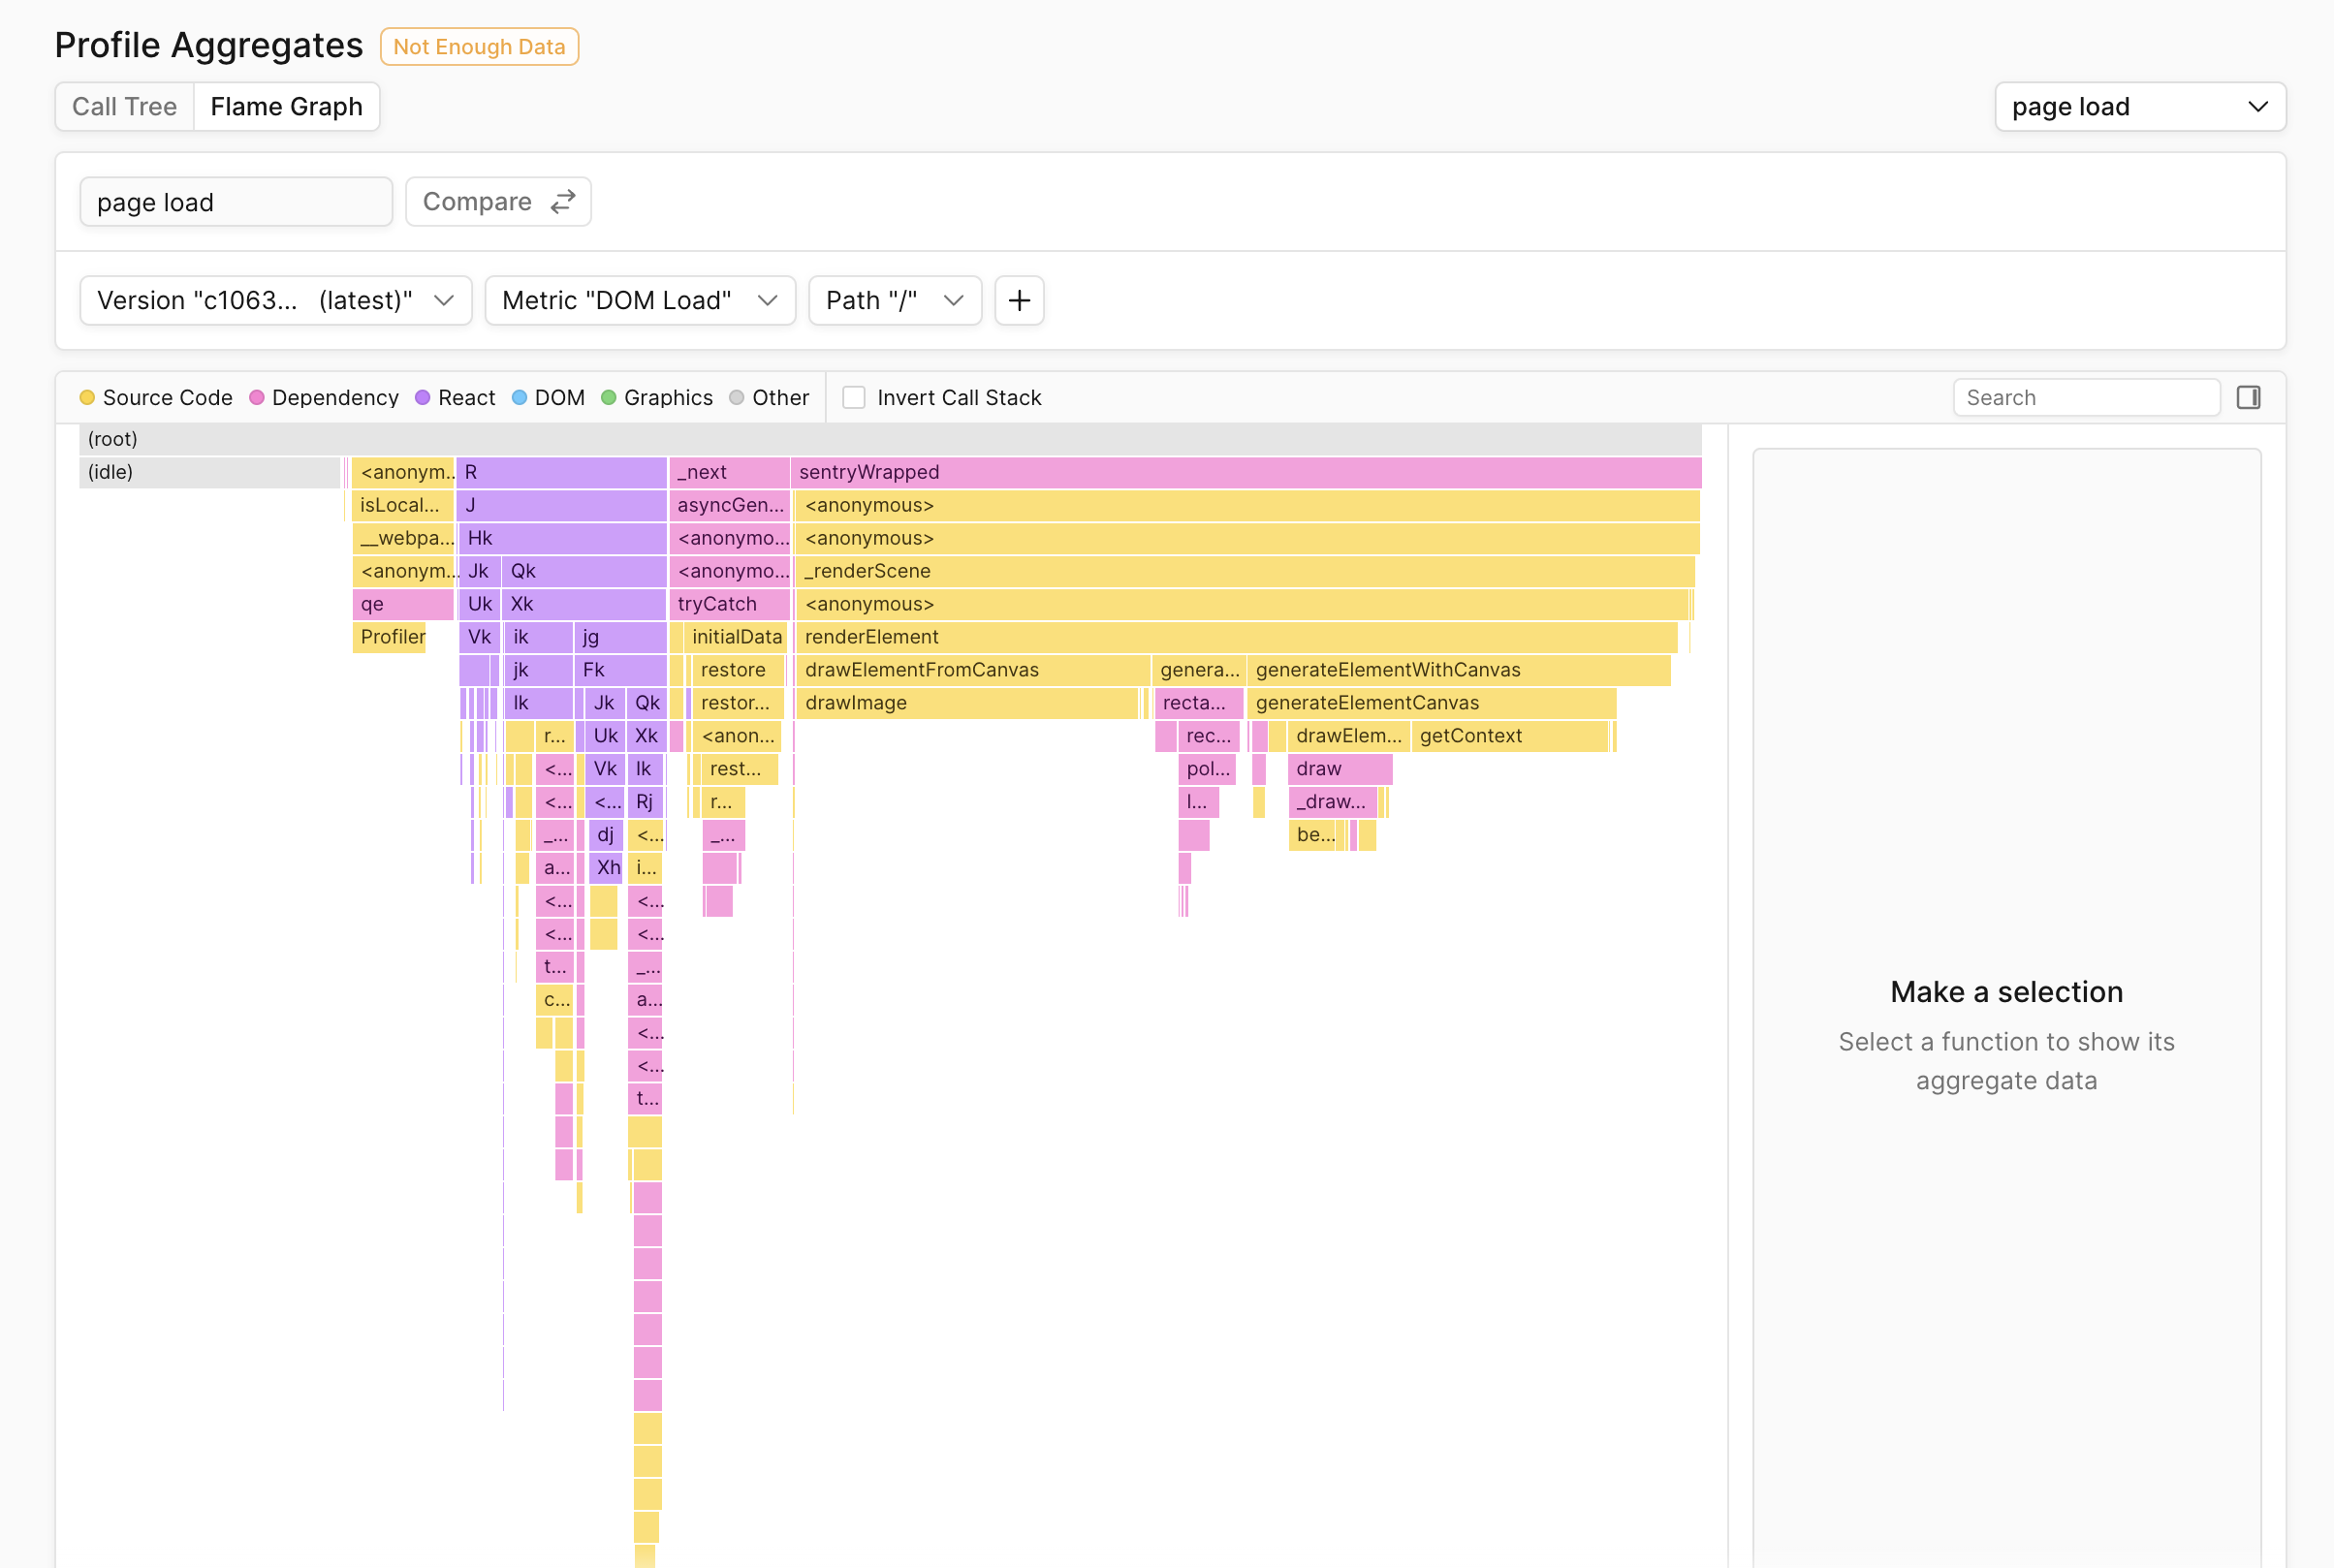
Below: Flamegraph of functions blocking DOM load on end users devices:
You can get started with Palette by signing up for a free trial.
How Notion Identifies Regressions By Profiling JavaScript in Production
Notion uses Palette to collect JavaScript profiles from production end users to identify which code is blocking their core performance metrics, such as typing_lag, initial_page_render, and more. This approach goes beyond the Chrome DevTools Profiler by aggregating profiles from all end users, allowing Notion to identify the most impactful performance bottlenecks across their entire user base instead of just a single browsing session.
By using Palette, Notion improved typing responsiveness, improved table interaction responsiveness, and fixed regressions to load and typing performance. Specifically, they were able to:
- Reduce page load latency by 15-20%
- Reduce typing latency by 15%
- Identify the cause of 60% of regressions
- Reduce time to resolution of some performance regressions by 3-4 weeks
Below is an example of a flamegraph showing a regression to their typing_lag metric:
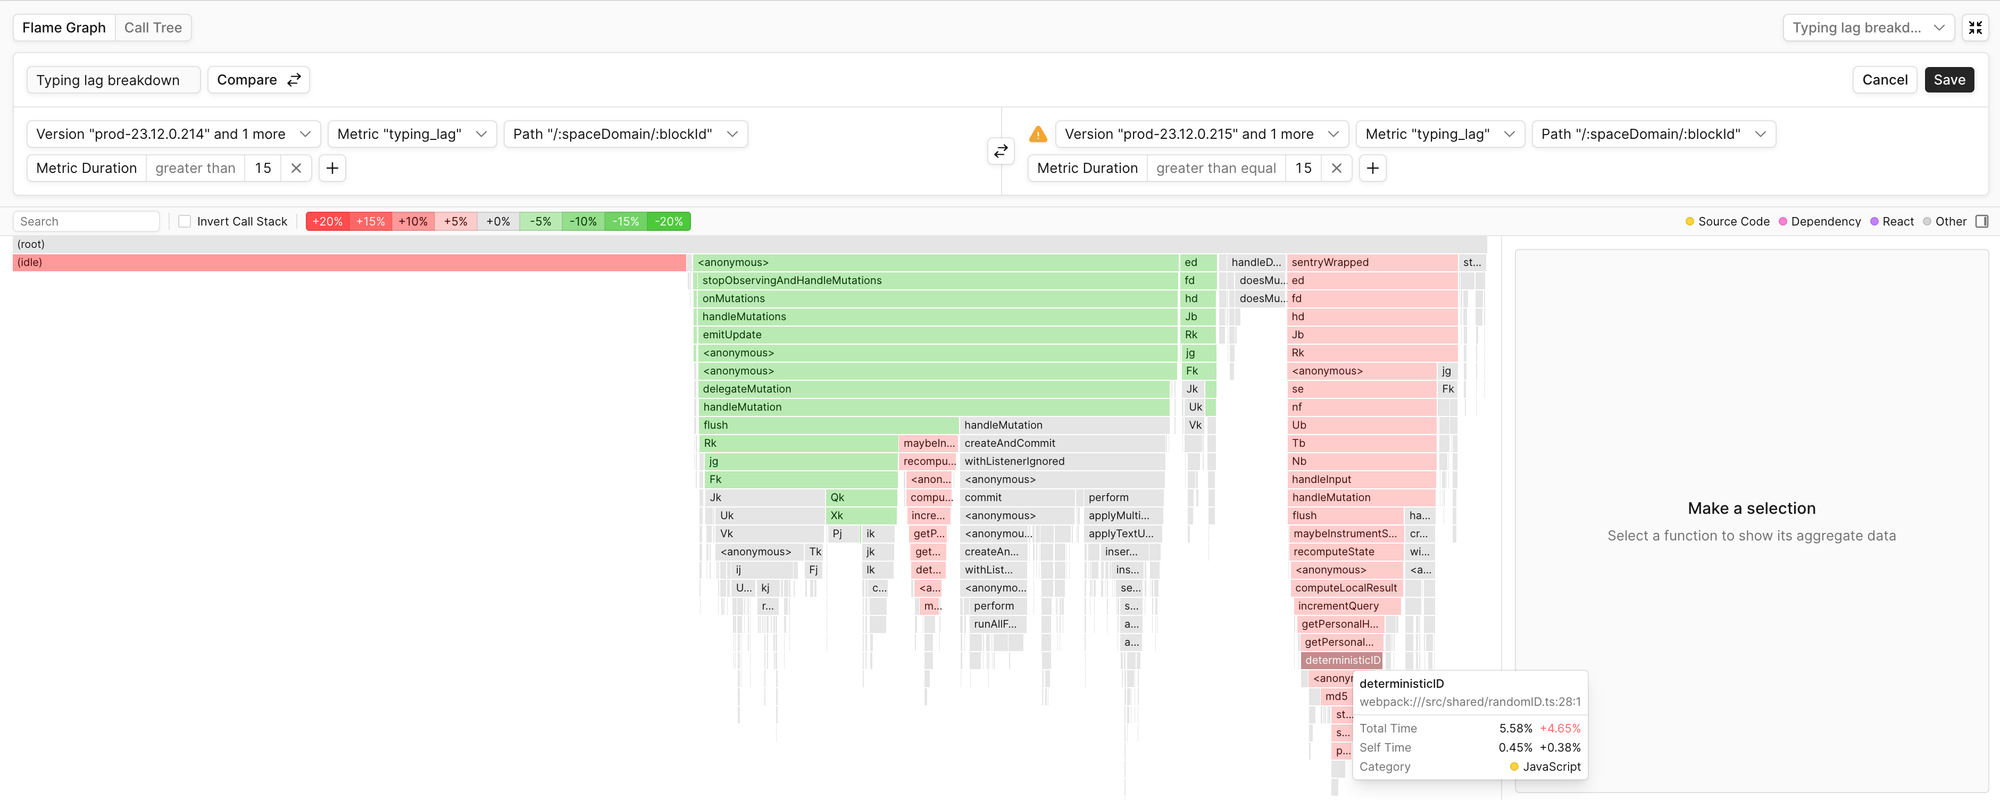
In this Profile Aggregate Comparison, functions colored red indicate an increase in total time between two releases.
After Carlo Francisco, a performance engineer at Notion, used Palette's Profile Aggregate Comparison and found the cause of a regression to initial_page_render, he said:
Someone put a bunch of code that was supposed to be lazy loaded into our main bundle that gets executed on load. It stuck out like a sore thumb in Palette's flamegraph.
To learn more, read our case study on how Notion used Palette to reduce typing latency by 15%.
Conclusion
Electron apps typically suffer from the same performance issues: slow startup time and poor interaction performance. But with the right approach to performance, your Electron app can compete with native apps.