TL;DR: The ever increasing complexity of web apps and JavaScript's single threaded nature is only making web apps harder to scale. Chrome DevTools is our bread and butter for maintaining and improving the performance of web apps as they scale, but local profiling often isn't representative of code execution slowing end user experiences. Companies facing these challenges, including Facebook, Microsoft, Slack, Dropbox, and Notion, have started profiling production to find and fix performance issues faster and more effectively. This blog post outlines their general approaches for profiling production.
Scaling JavaScript is Hard
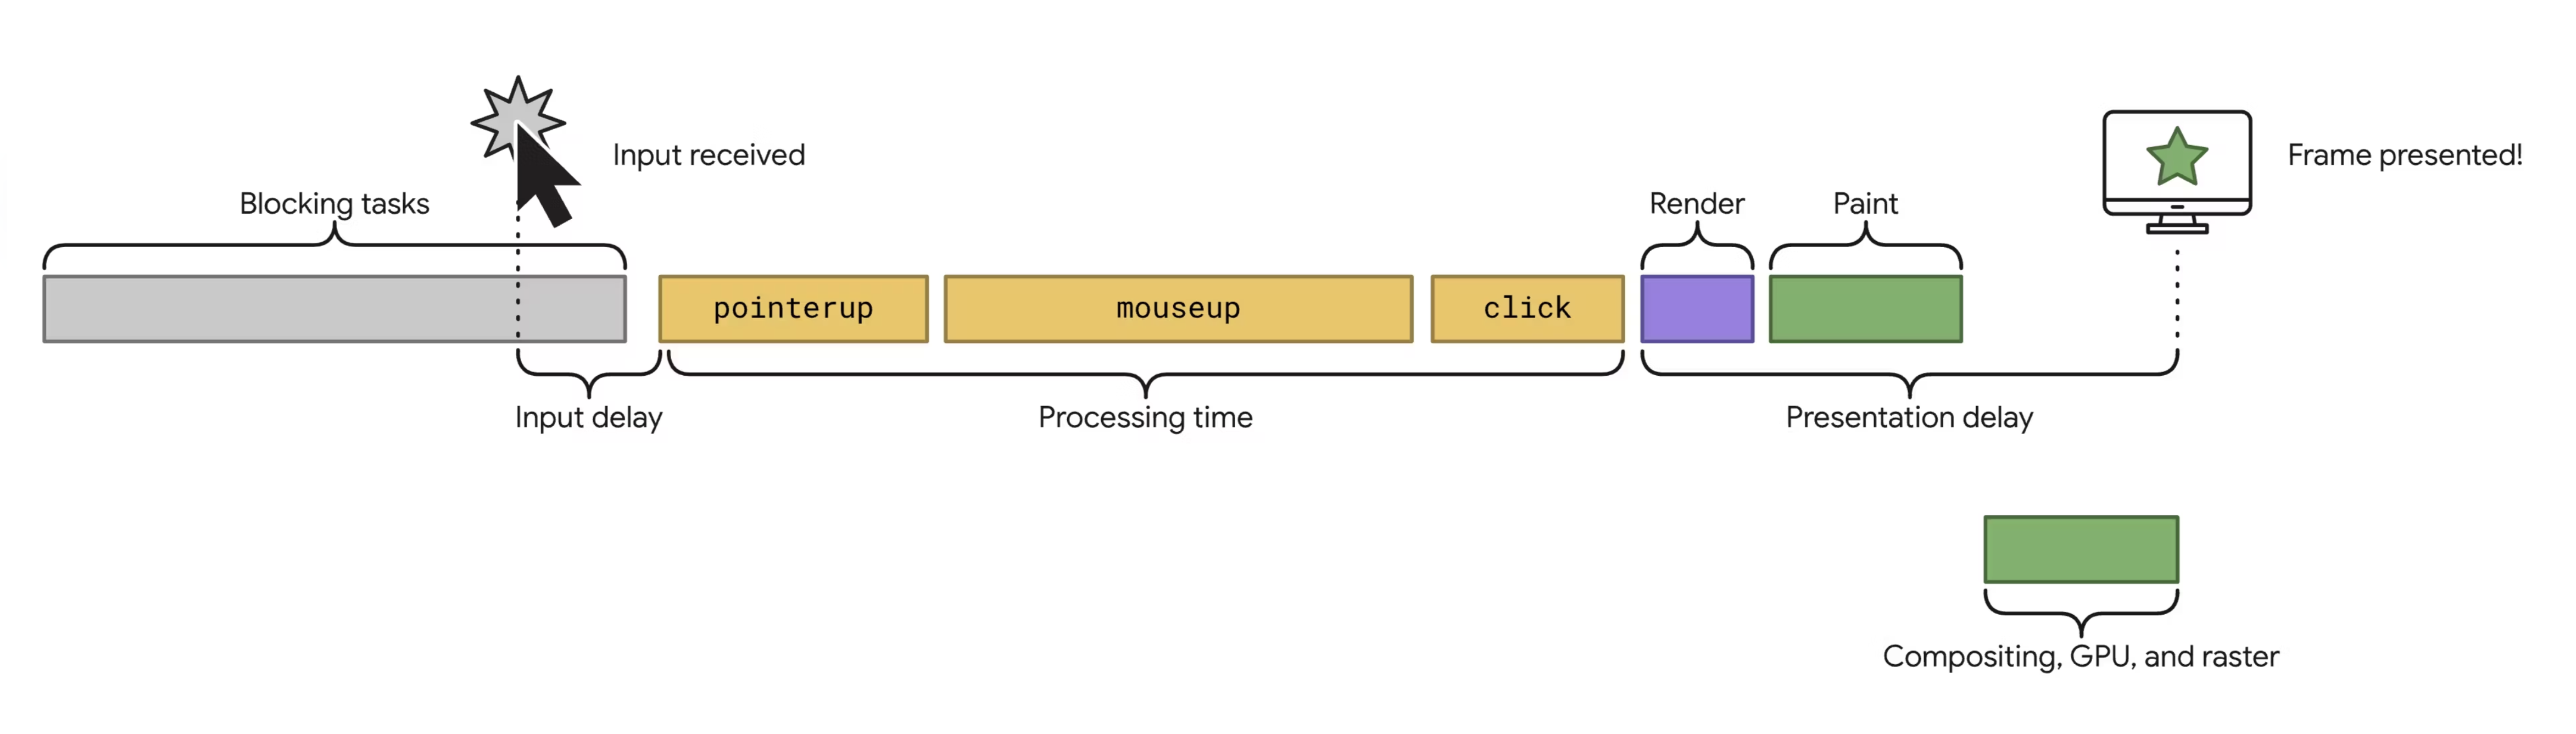
The overarching reason why web apps are hard to scale is the single threaded nature of JavaScript. All work in the browser must finish under 16ms for a page experience to run at 60fps, meaning your web app’s code execution competes with garbage collection and the browser rendering pipeline (Render/Layout, Paint, and Composite), which must all complete within 16ms. Exceeding this deadline will cause the user to perceive visual latency, as the browser will drop frames if it isn’t met.
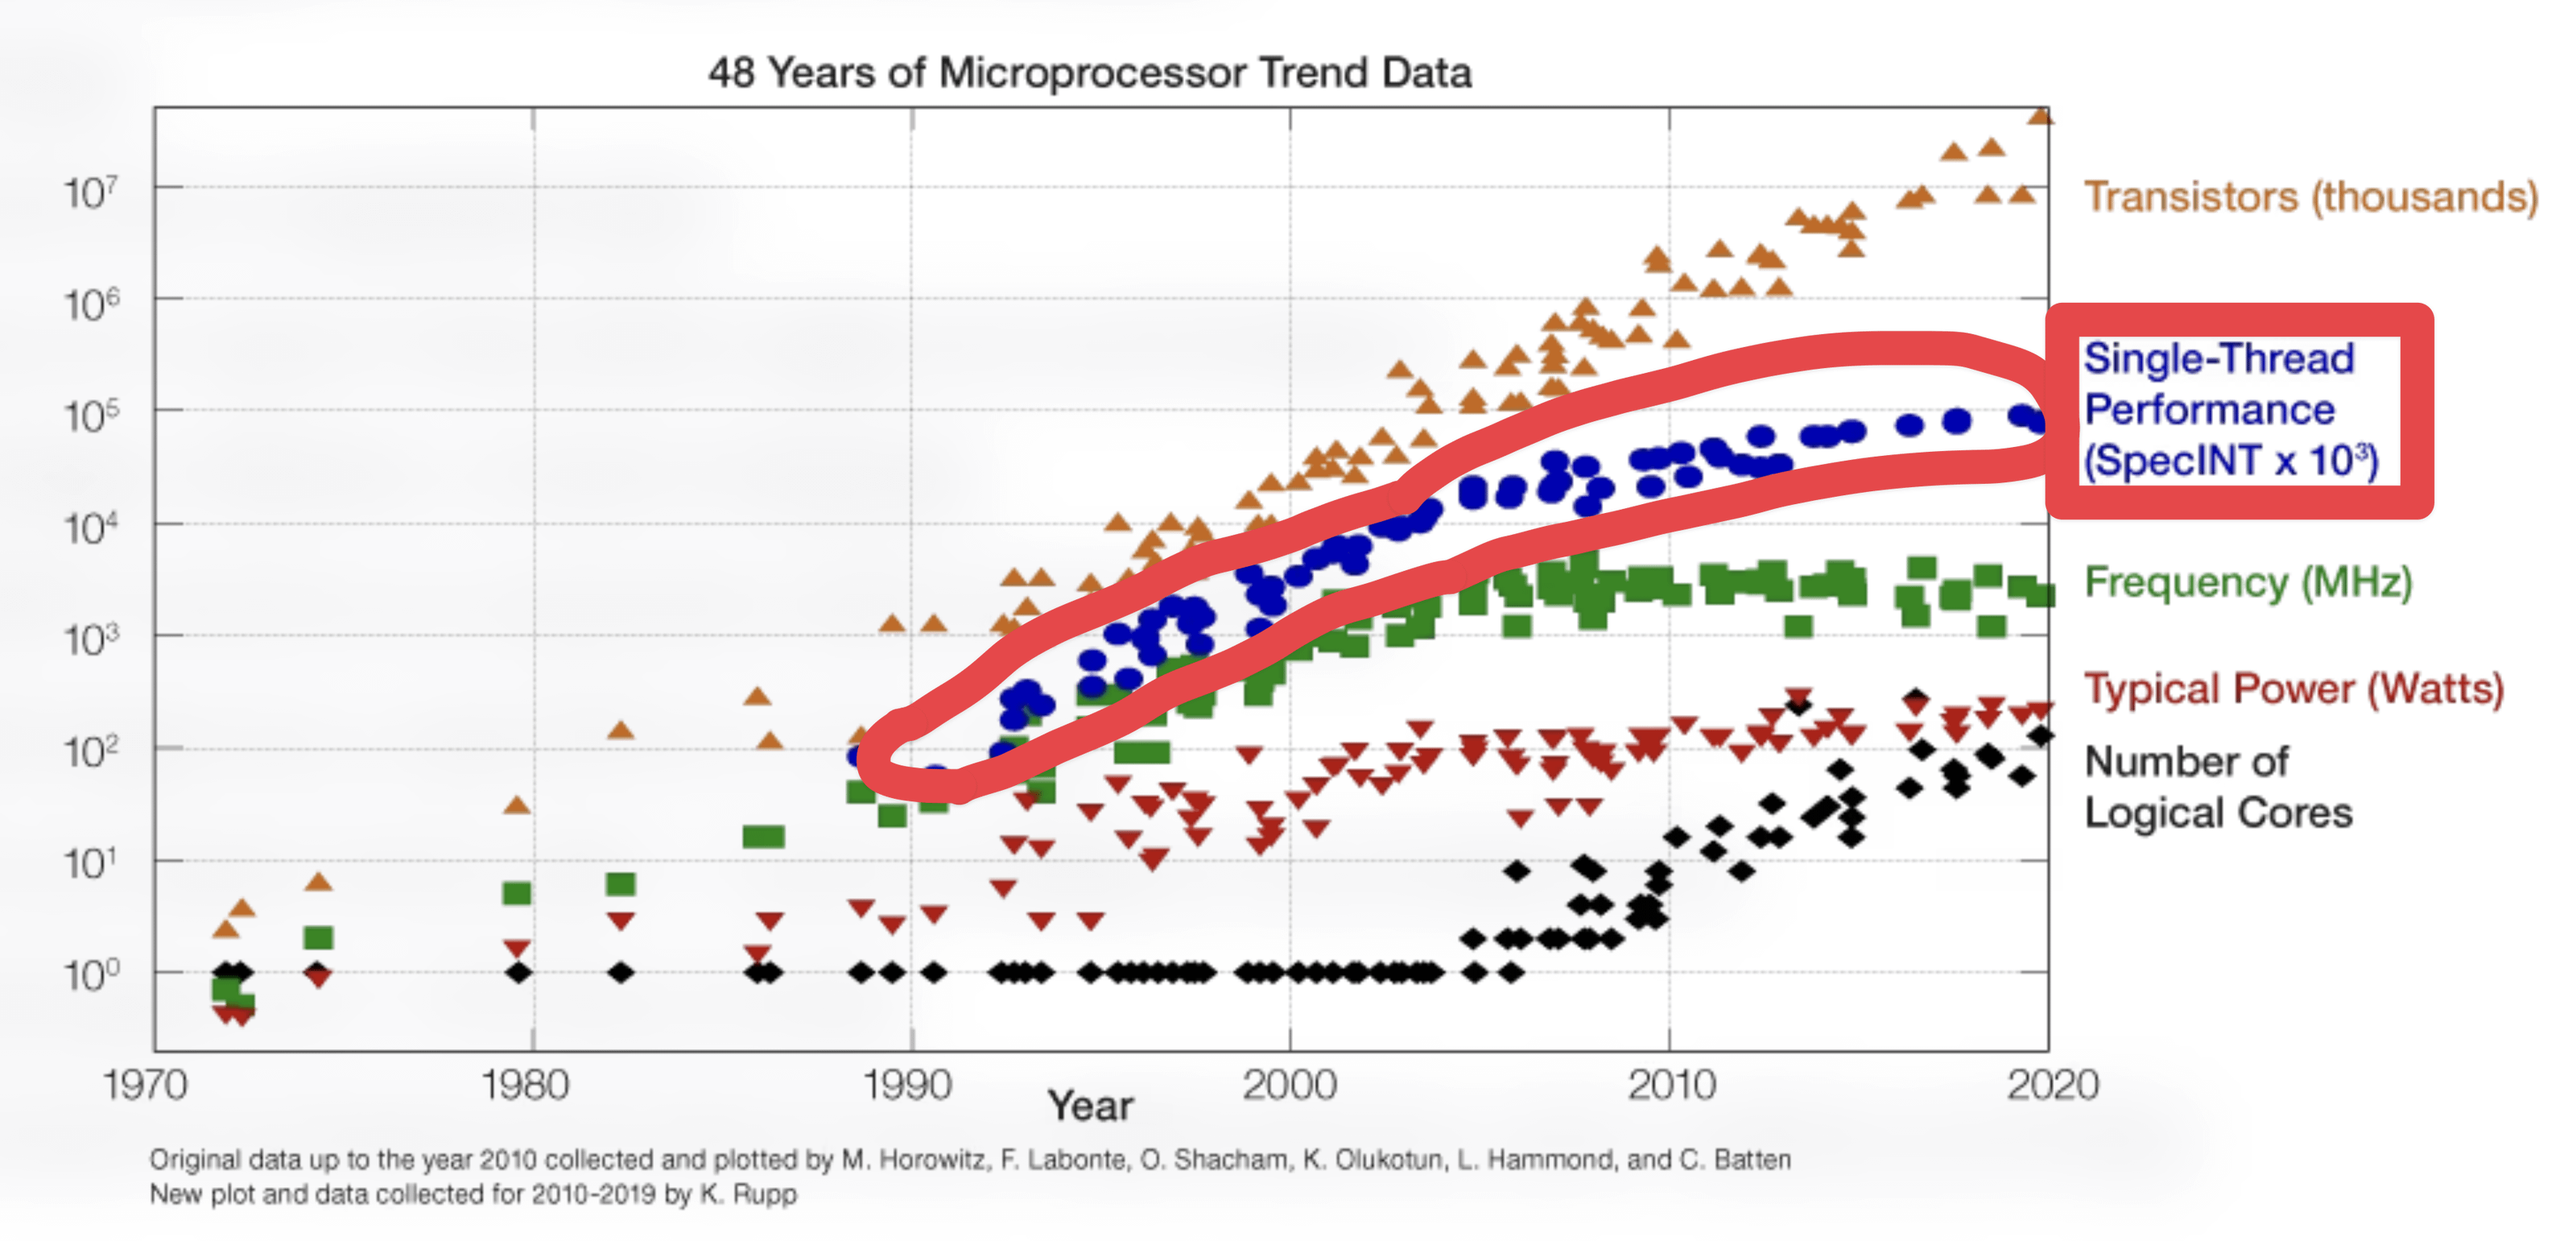
Web apps at scale (VSCode, Slack, Notion, Discord, Spotify, etc) span millions of lines of JavaScript code, only making scaling them even more difficult. These companies have dedicated performance teams but still face challenges with maintaining and improving performance. Furthermore, single threaded performance is plateauing.
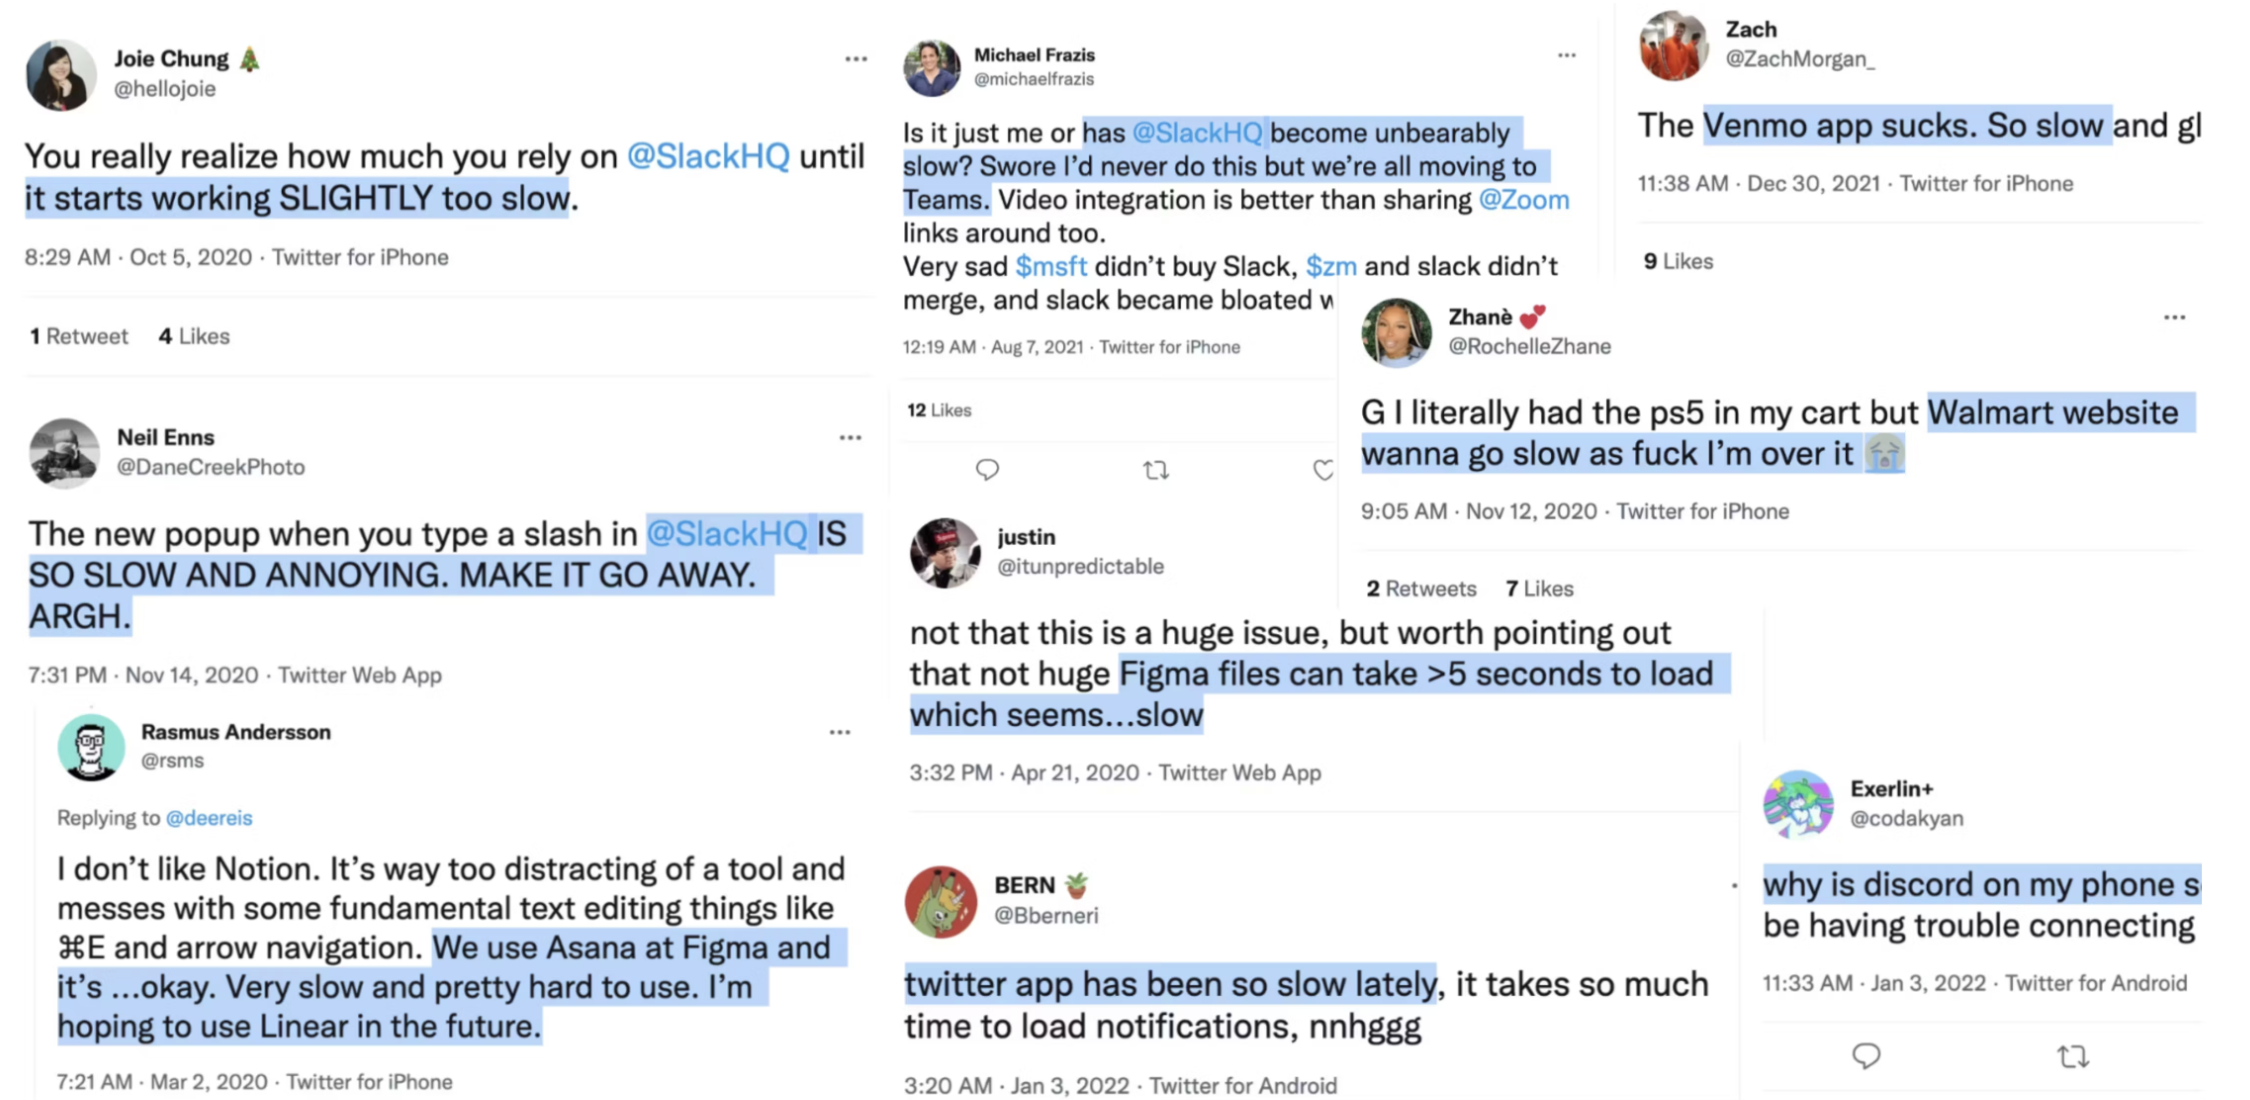
Maintaining the performance of web apps as they scale is only getting harder and users are noticing.
Web devs have only one tool at their disposal to fix these performance issues: Chrome DevTools, but it has a few shortcomings when it comes to fixing end user performance issues.
Where Chrome DevTools Falls Short
While Chrome DevTools is a performance engineer’s bread and butter, it has a few shortcomings:
- Reproducing end user performance issues is difficult. Variance in end user hardware, application state, and user flows cause Chrome DevTools to stray from what's truly slow for end users. Accurately reproducing performance issues requires the end user to cut tickets outlining how to reproduce the issue and the developer to reproduce the exact state, user flows, and hardware described in the ticket. But relying on user reporting of performance issues is brittle, since most slow user experiences go unreported.
- Regressions are difficult to attribute. Every new release of your app risks regressing performance. At scale, pull requests for new releases of your app might often merge over 100 commits from changes across multiple teams, making regression attribution difficult. We've seen teams guess which code to revert changes to try to fix a regression without having any effect. If reverting changes didn’t work, these teams would continue reverting changes until the metric returned to normal or baseline their metrics to the regressed value.
- Identifying optimization opportunities is difficult. With limited visibility into code paths that were slow for end users, it's difficult to identify opportunities for improving performance metrics.
The underlying limitation with profiling code execution in Chrome DevTools is that it isn't always representative of code paths that are slow for end users. To overcome these limitations, companies began exploring new methods for profiling performance in production environments.
Early Origins: Facebook’s End User Profiler Polyfill
Because of this limited visibility into production JavaScript code execution, a team at Facebook decided to tackle this problem in September of 2021 by running an experiment to profile JavaScript in production.
Here's what they learned by profiling JavaScript in production:
This JS profiler was enabled for only a small percentage of Facebook users, and only instrumented functions of 10 statements or more in order to limit performance impact and to limit the quantity of profiling data collected. Nevertheless, we found it extremely valuable for understanding Facebook.com's performance in the field and for finding optimization opportunities.
— Andrew Comminos (Staff Engineer at Facebook) (source)
Facebook’s early experimentation served as the basis for the Chrome team standardizing the Self-Profiling API.
The Self-Profiling API
The Self-Profiling API allows for programmatic and efficient end user JavaScript profiling. It's used by Slack, Microsoft, Facebook, Dropbox, Notion, and others to profile JavaScript running for end users.
Starting the profiler requires two configuration options:
- sampleInterval: desired sample interval (in ms), sets profiler's CPU overhead
- maxBufferSize: desired sample buffer size limit, in number of samples, sets profiler's memory overhead
Here is an example of using the Self-Profiling API:
// Example of profiling a react render
const profiler = new Profiler({ sampleInterval: 10, maxBufferSize: 10_000 });

react.render(<App />);

const trace = await profiler.stop();
sendProfile(trace);
Overhead
When enabling the Self-Profiling API in production, Facebook reported a <1% impact on pageload (p=0.05). At Palette, none of our largest customers (>100M users) have reported performance regressions after enabling the profiler in production.
Filling the Gaps in Chrome DevTools
In light of the Self-Profiling API and Chrome DevTools lacking insight into slow code paths for end users, we asked “What if Chrome DevTools Profiler was fed production profiles from end users?”
Here are a few examples of use cases this would enable for a specific end user:
- Identifying impact of 3rd party scripts on pageload
- Identifying slow React hooks and render logic
- Identifying my application code blocking interaction latency
Efficiently Finding Bottlenecks by Merging Profiles
At scale, individually inspecting millions of end user profiles isn’t practical, so a way of summarizing them would be helpful. Merging all collected profiles into a single profile would effectively do this.
Here’s what an example of what merging profiles would look like:
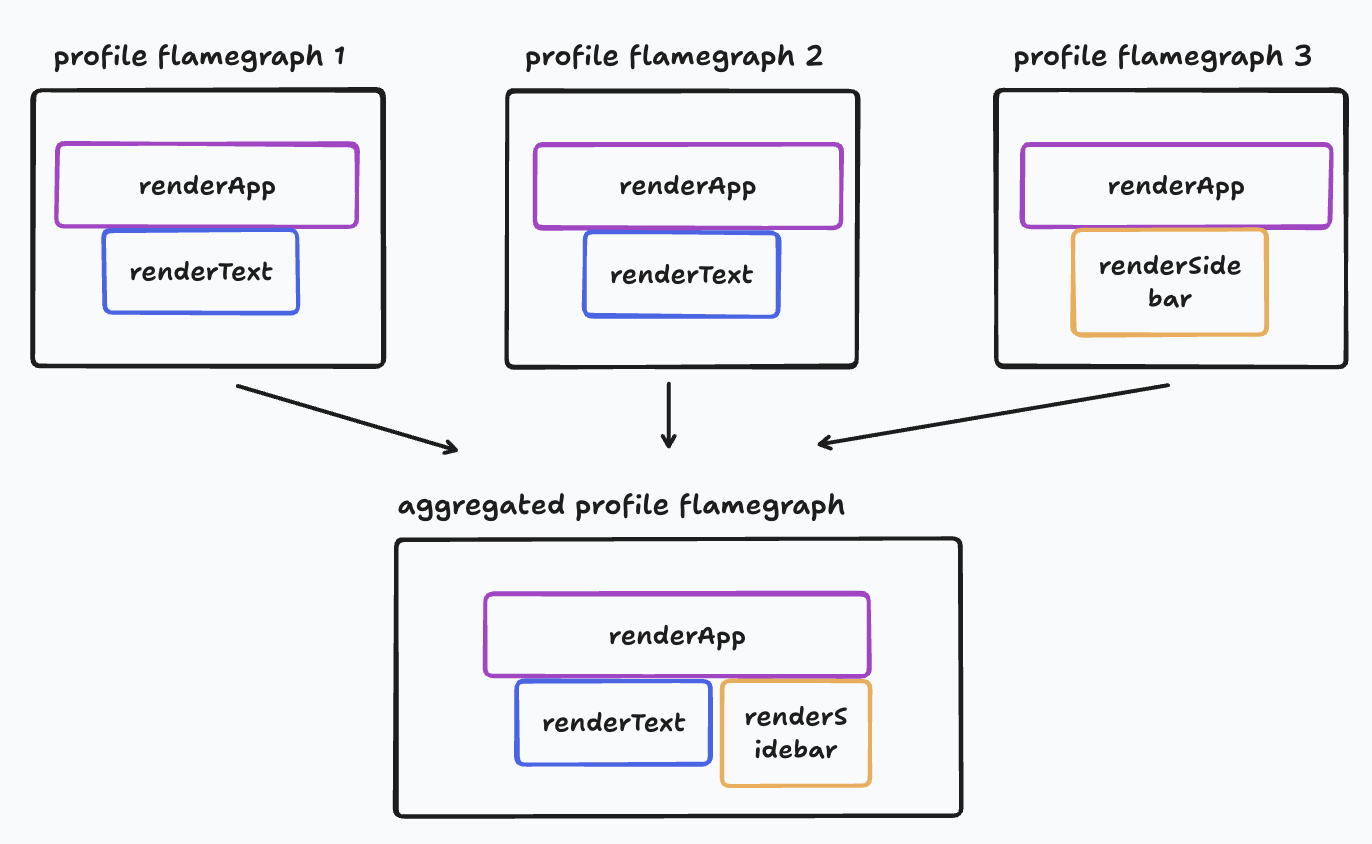
Individual user profiles allow understanding performance issues for a specific user. Inspecting a merged profile allows us to answer the same questions but across all our end users.
Here are a few examples of questions profile merging answers:
- Which 3rd party scripts impact initial page render the most across all end users?
- Which React hooks and render logic impact interaction performance across all end users?
Finding Regressions by Comparing Merged Profiles
Merged profiles also allow us to easily compare function execution time before and after a regression. Imagine you’re building a text editing app and notice typing performance regressed. Comparing the merged profiles of your app between the version before the regression and the versions after would show you exactly which functions have increased in execution time after the regression.
See this example of comparing performance before and after a regression, with total time increases and decreases in green and red respectively:
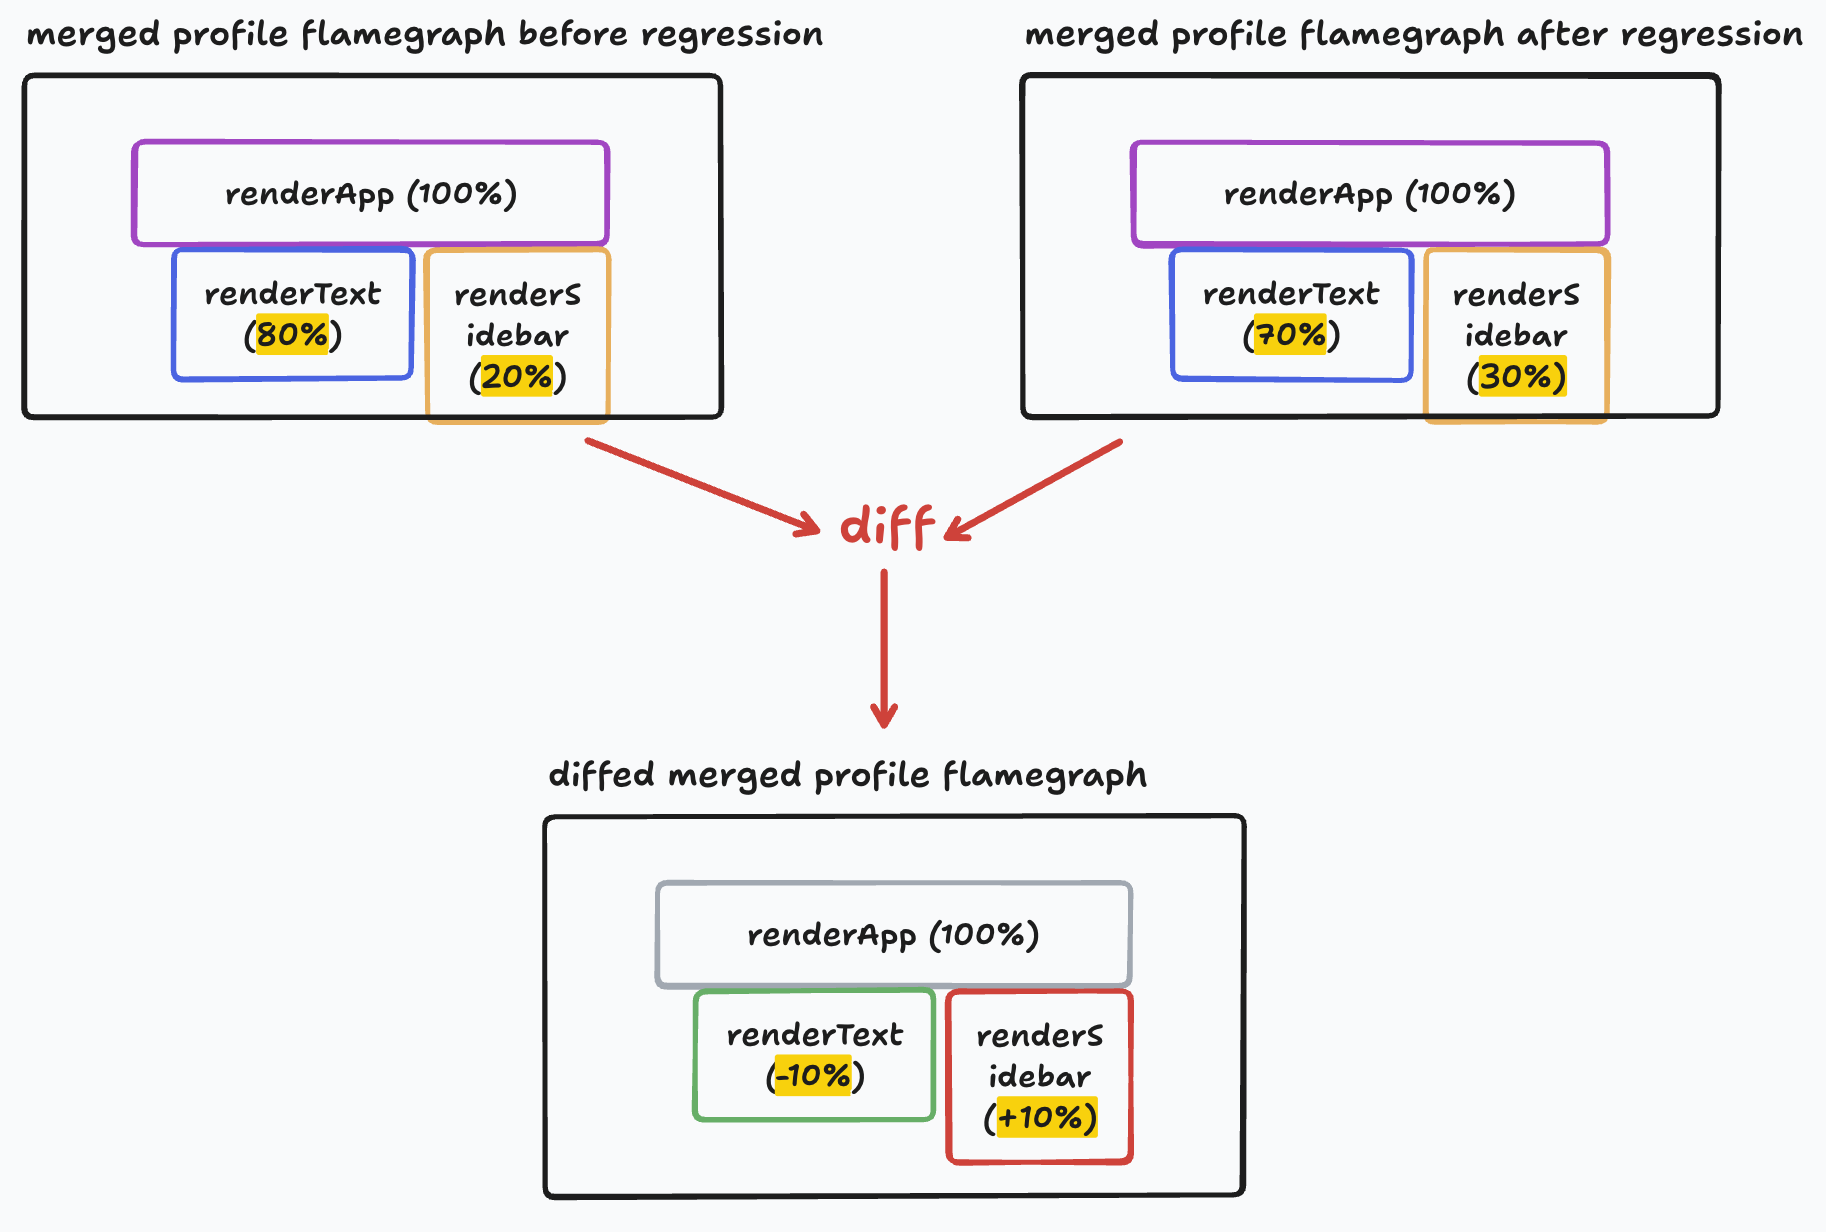
With enough sampling data (at Palette, we recommend 1M profile stack samples), these merged profiles are stable enough to identify regressions.
Here are a few examples of questions comparing merged profiles answers:
- Which 3rd party scripts regressed pageload across all end users?
- Which React hooks and render logic regressed interaction performance across all end users?
Building Profile Merging and Comparison at Palette
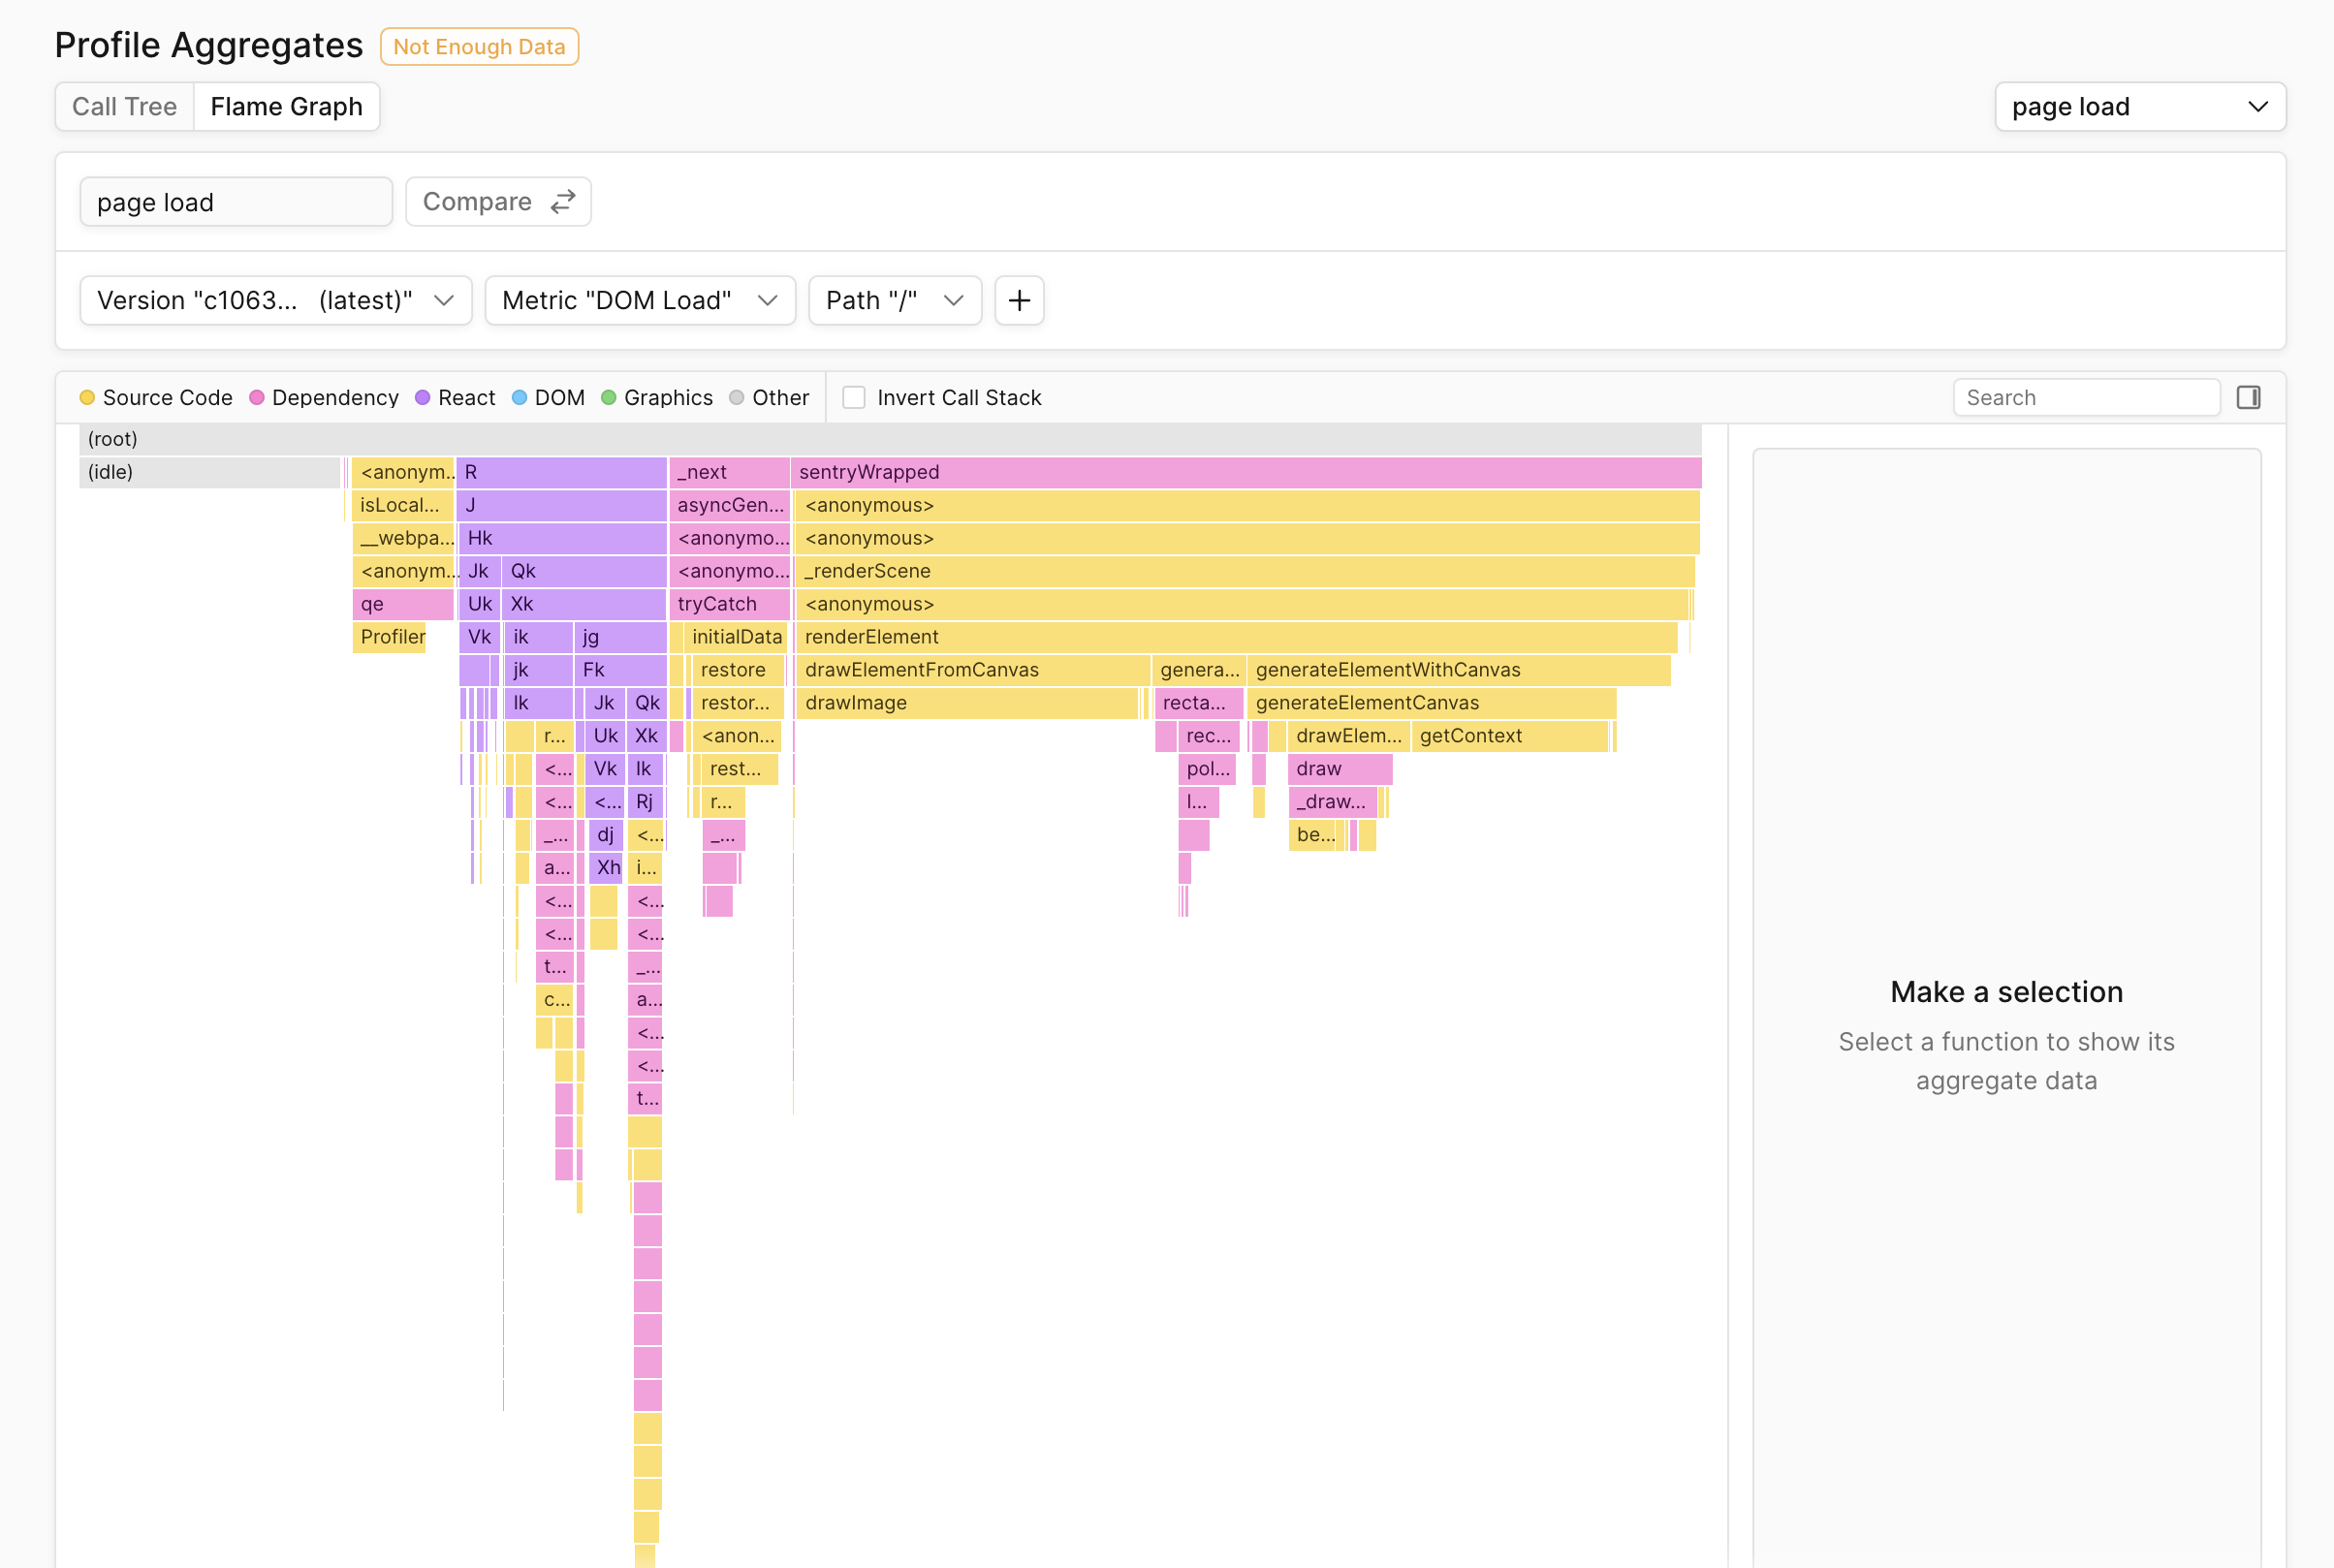
At Palette, we’ve built out profile merging and comparison capabilities and call them Profile Aggregation and Profile Aggregate Comparison respectively.
Below is an example of what a flamegraph for a merged profile looks like in Palette:
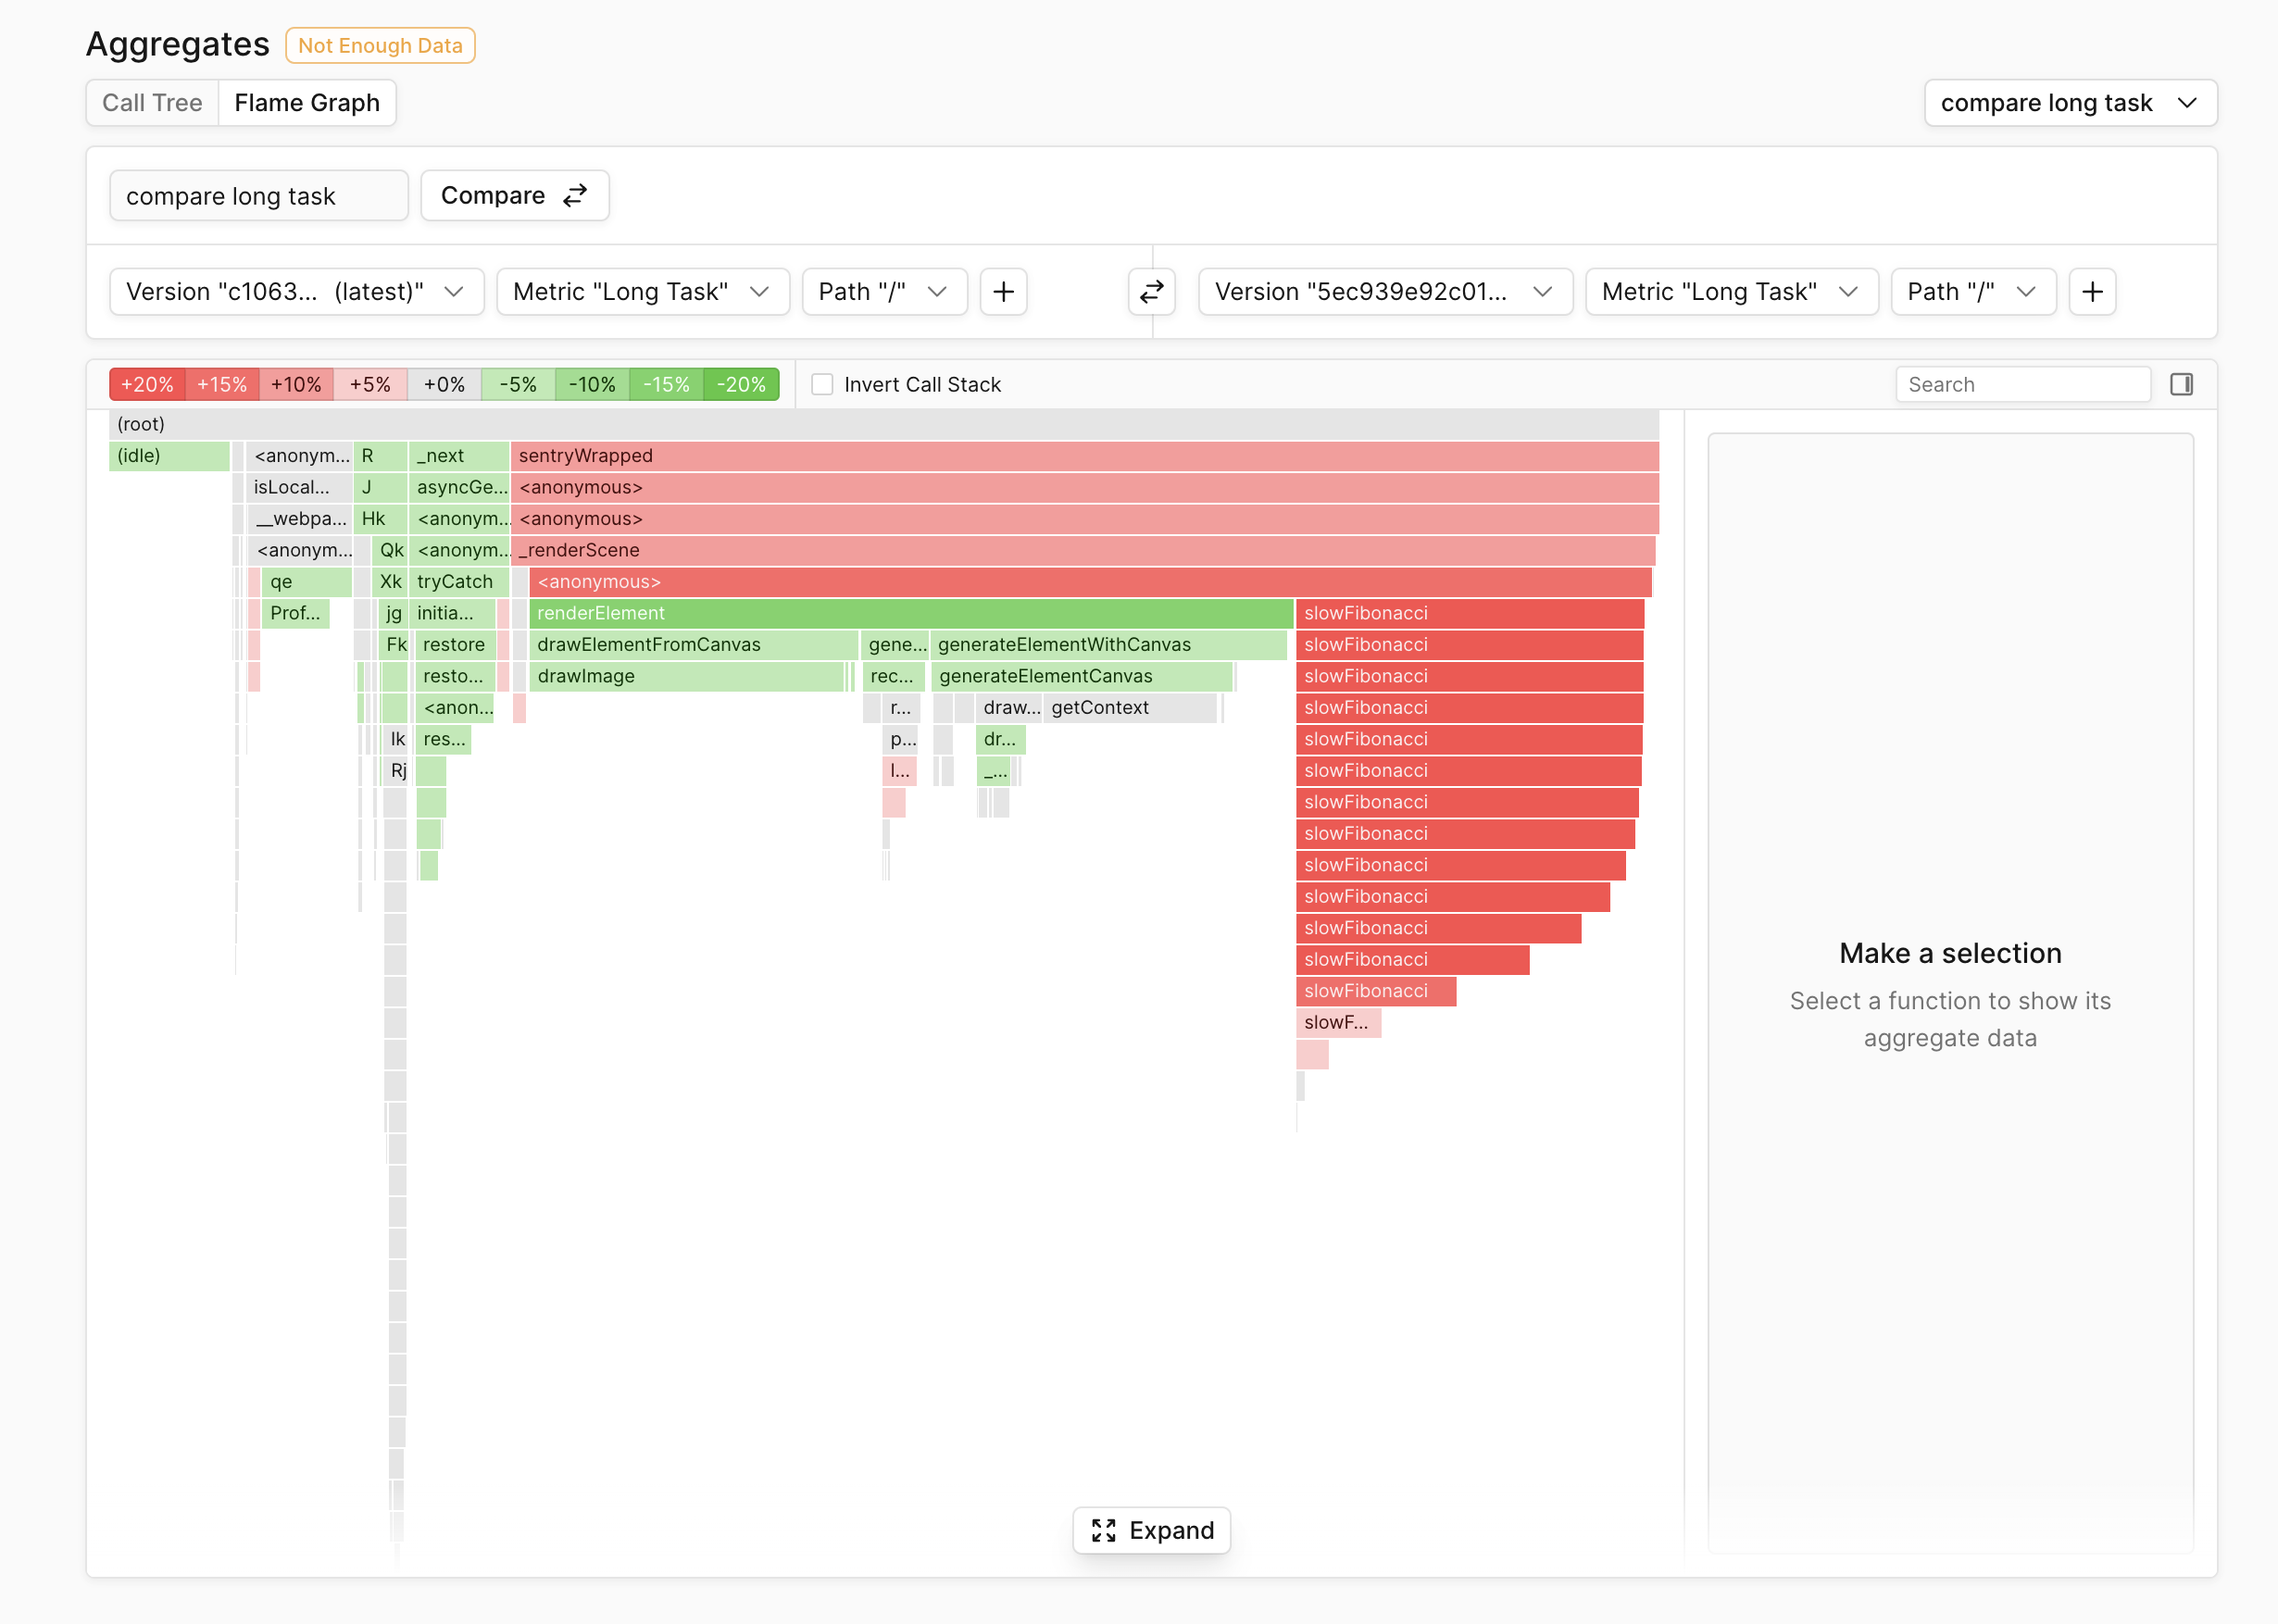
Below is an example of what a merged comparison flamegraph looks like in Palette:
The foundation of these features are based on these merging and comparison concepts and have advanced filtering capabilities layered on top.
Filtering Profiles
Filtering allows drilling into functions running during a specific metric, on a certain page, and on a certain version/s of your app, allowing answering more involved performance questions: “Which functions regressed our custom metric “typing_lag” in the last version of our app on the homepage?”.
Below is an example of what a merged comparison flamegraph looks like in Palette:
Palette supports the following filters:
| Filter | Description |
|---|---|
| Version | The version of your app |
| Connection | The effective connetion type of the session |
| Path | The page to filter metrics from |
| Device | The device type of the session |
| CPU Cores | The number of CPU cores of the device |
| Memory | The amount of memory (GB) of the device |
| Region | The region code |
| Tag | The tag name and value set by tag |
Here are some examples of questions filtering helps answer:
- Which functions regressed performance on low-end devices? (ex. filter where
cores < 4) - Which functions regressed typing performance for a certain user? (ex. filter where
tag user_id = 'u-123') - Which functions regressed pageload performance on the homepage for a certain version of your app? (ex. filter where
path = '/'andversion = 'v1.2.3')
Source Code Previews Using Source Maps
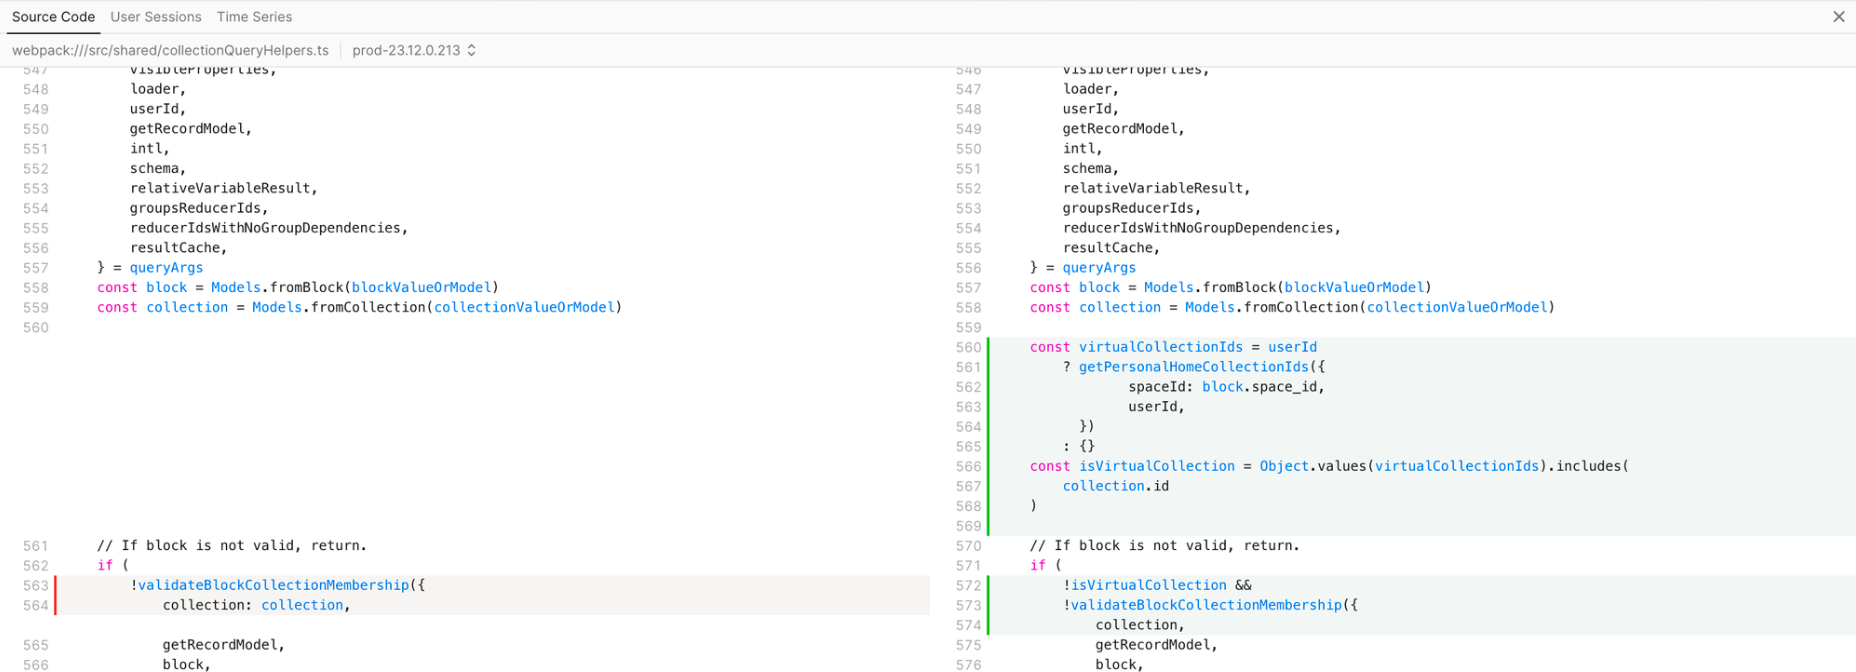
Palette allows uploading source maps to show unminified function names and source code and even goes a step further by showing code diffs for regressed functions. Below is an example of a code diff that caused a typing performance regression in Notion:
Self-Profiling in the Wild — Notion Case Study
After building out Profile Aggregation and Comparison, Notion was one of Palette’s first large customers to use them in production.
By using Palette, Notion improved typing responsiveness, improved table interaction responsiveness, and fixed regressions to load and typing performance. Specifically, they were able to:
- Reduce page load latency by 15-20%
- Reduce typing latency by 15%
- Identify the cause of 60% of regressions
- Reduce time to resolution of some performance regressions by 3-4 weeks
To learn how they used Palette, read the full case study.
Fixing Regressions to Document Loading
Notion measures document load performance with an internal custom metric called initial_page_render (IPR), and it often regresses because it’s highly sensitive to newly added initialization code. After integrating Palette and seeing a regression, the team created a Profile Aggregate Comparison to see which code regressed initial_page_render and saw the comparison flamegraph below:
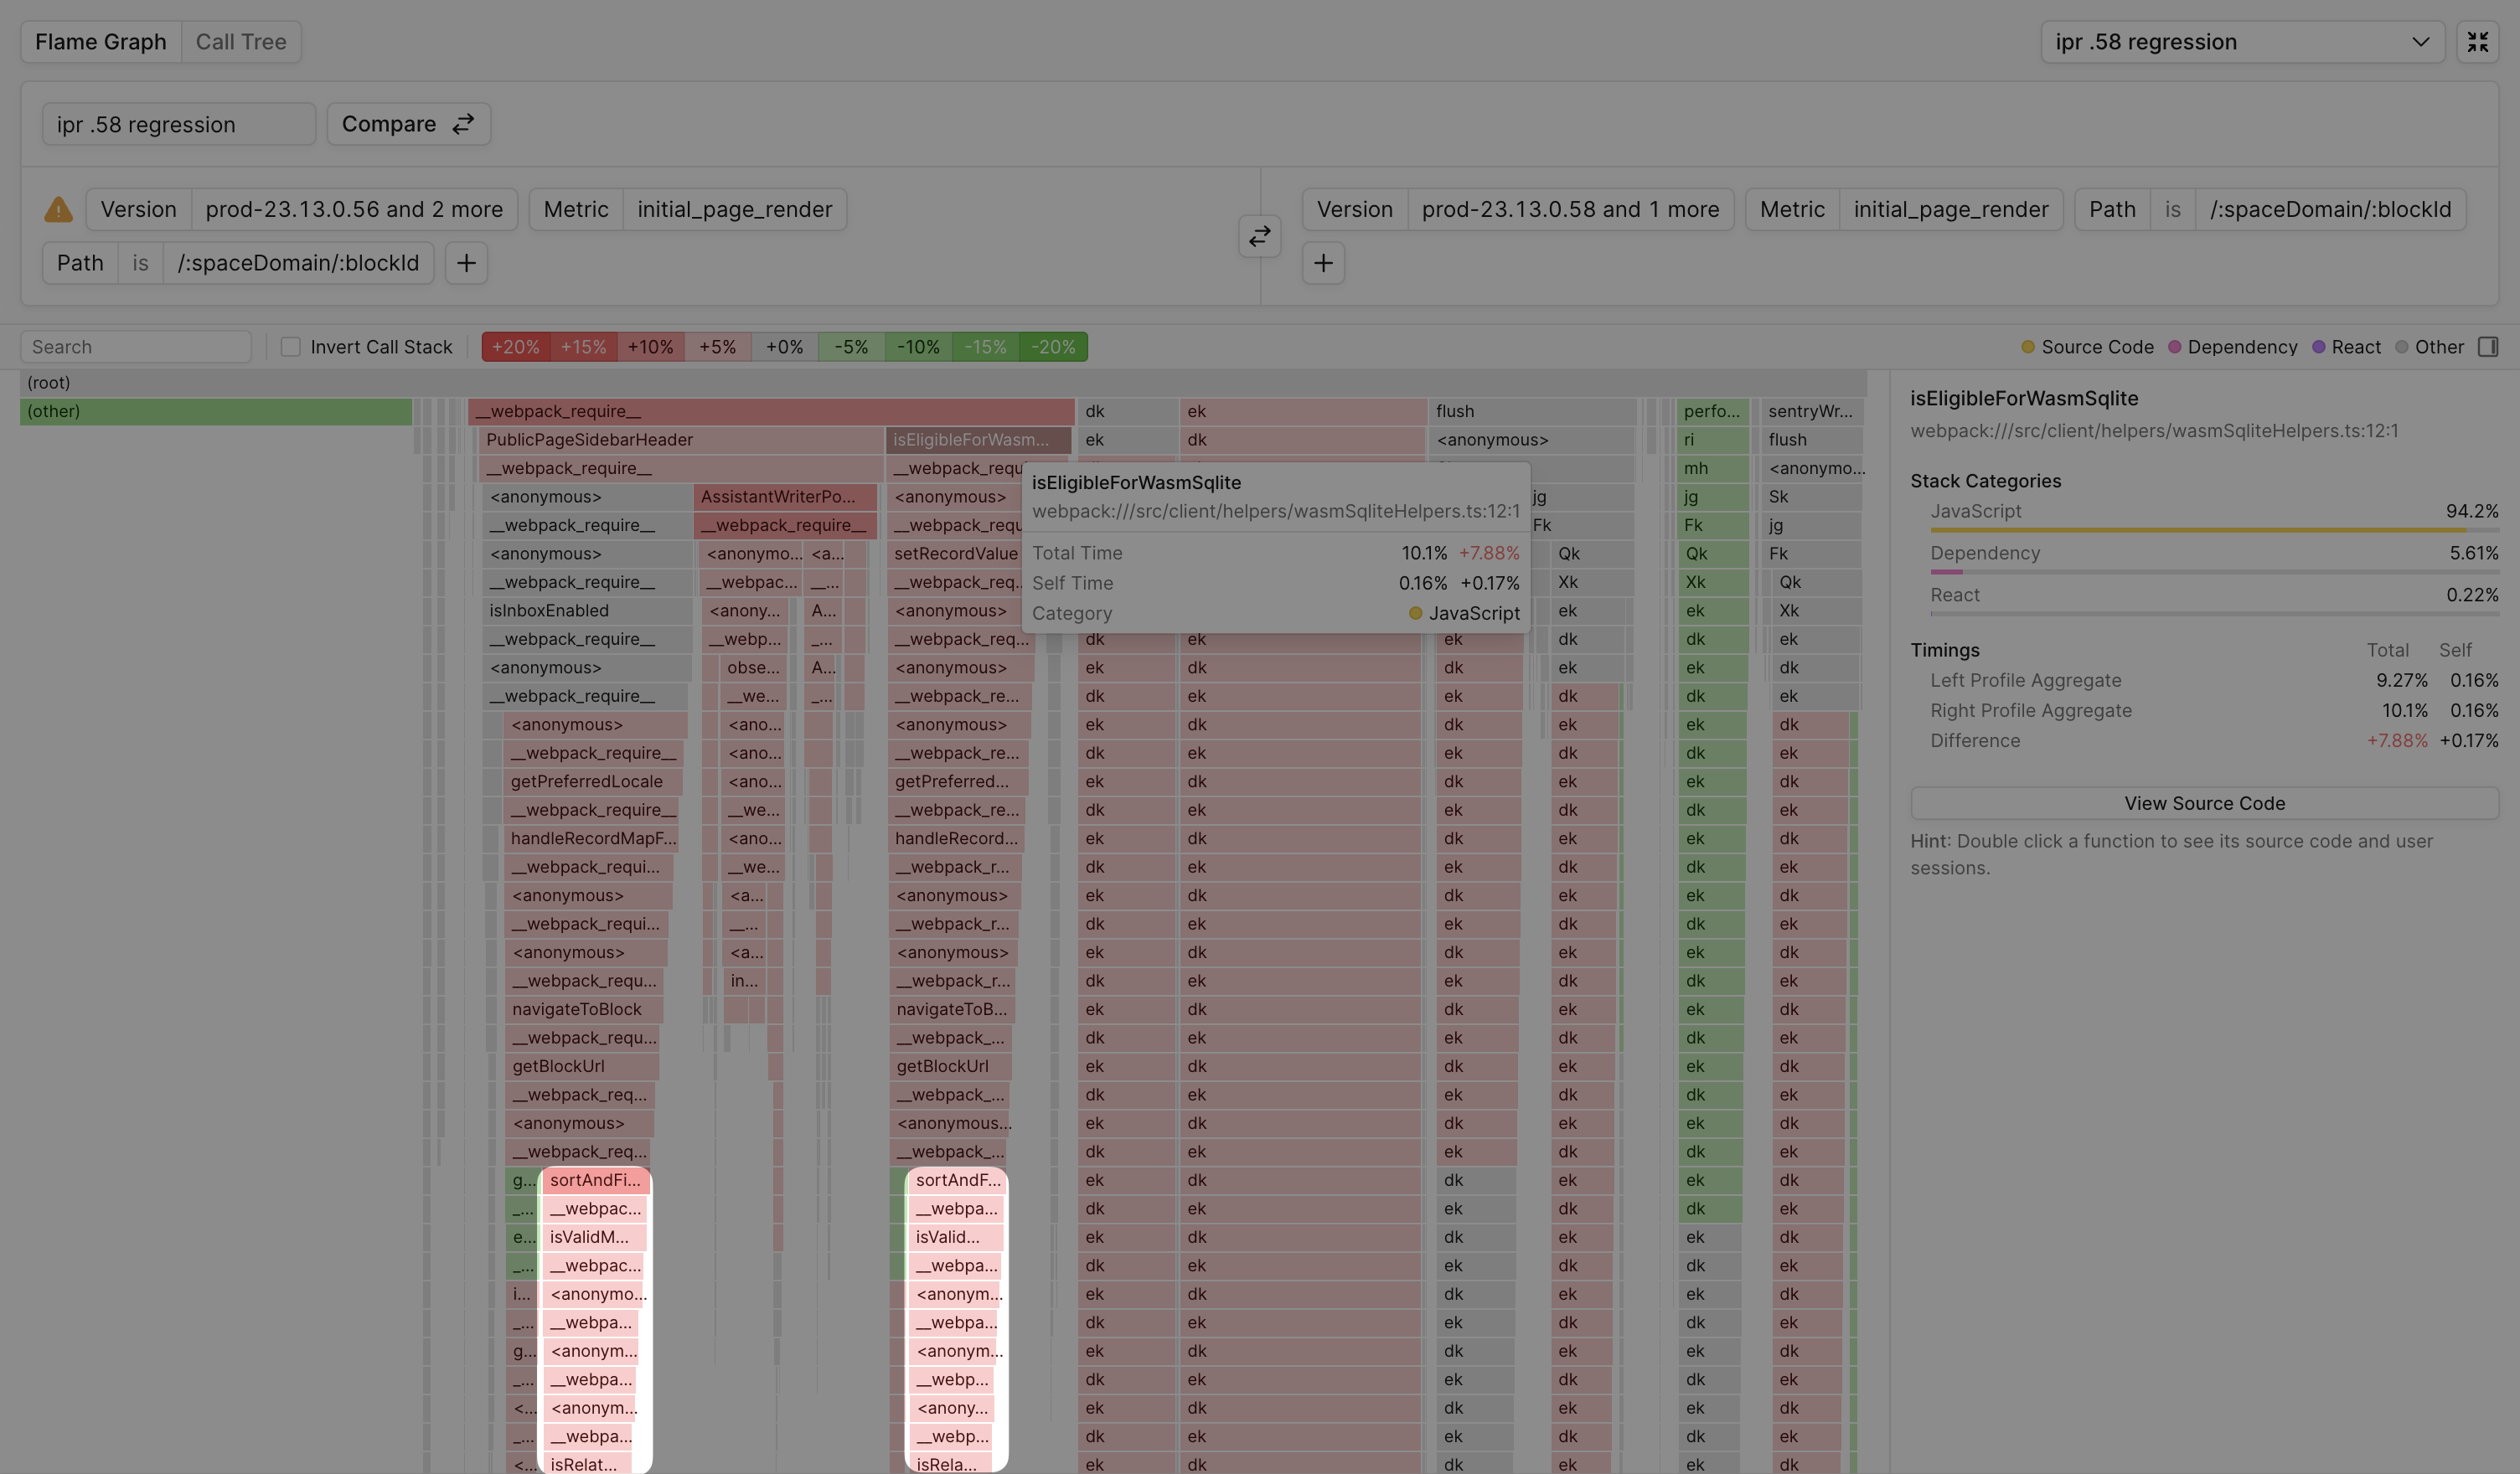
Despite their codebase having grown past 1M lines of code, it was clear exactly which newly added code regressed document rendering. Here’s what one of their engineers said:
By using Profile Aggregate Comparison, I saw someone added some code that was supposed to be lazy loaded into our main bundle that gets executed on load. It stuck out like a sore thumb in the flame graph.
— Carlo Francisco (Performance Engineer at Notion)
To learn how they used Palette to fix other performance issues, read the full case study.
Conclusion
Profiling production with the Self-Profiling API is the next new frontier of web performance, allowing us to understand end user performance issues that go undetected by Chrome DevTools. Our north star for performance should be guided by what’s slow for end users, not what’s slow locally, and production profiling enables exactly that.