Since 2010, Notion has worked on a web-based workspace that lets users write, plan, and organize — adding features over time, such as content blocks, collaborative tools, and AI features. Notion has seen incredible growth, recently crossing more than 100M users ranging from students to enterprise customers. But as Notion scaled, it became difficult to pinpoint the cause of performance regressions and identify opportunities for improving performance. As a result, maintaining typing and load performance became a frequent challenge. In July of 2023, Notion integrated Palette to tackle their challenges with performance.
Palette offers code-level visibility into slow front-end user experiences. Specifically, Palette is a performance observability tool that collects front-end performance metrics, javascript profiles, and traces from end users.
By using Palette, Notion improved typing responsiveness, improved table interaction responsiveness, and fixed regressions to load and typing performance. Specifically, they were able to:
- Reduce page load latency by 15-20%
- Reduce typing latency by 15%
- Identify the cause of 60% of regressions
- Reduce time to resolution of some performance regressions by 3-4 weeks
Background
Before integrating Palette, Notion faced the following performance challenges:
- Local profiling was insufficient for reproducing slow experiences from end users. Variance in hardware, user flows, and document size made performance regressions unpredictable and difficult to identify ahead of time.
- Fixing regressions was time consuming. Reproducing regressions took weeks, if not months. Regressions would go unresolved and the team would need to baseline their metrics to the regressed state. Engineers would manually reproduce slow experiences using the Chrome DevTools profiler against an end user’s Notion document upon user consent. This method was time consuming and unable to find the root cause of performance regressions.
- Regressions were difficult to attribute. Multiple teams would ship code changes that regressed typing and load performance. Pull requests for new releases of the app would often merge over 100 commits from changes across multiple teams. Attributing the regression to a specific team was frequently guesswork. The team would revert changes to try to improve a metric without it having any effect. If reverting changes didn’t work, the team would continue reverting changes until the metric returned to normal or baseline their metrics to the regressed value.
- Identifying optimization opportunities was difficult. With limited visibility into code paths that were slow for end users, it was difficult to identify opportunities for improving performance metrics.
Introducing Palette
Palette ties slow user experiences to the corresponding lines of code. It measures the latency of code execution during key user-driven events such as page load, typing, and scrolling. It does this by collecting performance data from end users - including traces, profiles, and metrics.
Technical Overview
When designing Palette, our goal was to minimize Palette’s overhead — we wanted to keep the total amount of time taken by Palette to at most 3%. Since integrating, Notion has been monitoring Palette’s impact on Notion and has noticed no perceivable regressions to product performance or stability.
Palette SDK Design
We had four principles when designing the SDK:
- Palette’s SDK should run at the lowest priority.
- It should minimize blocking the main thread, deferring work whenever possible.
- Users only pay an overhead cost for the SDK features they use.
- Only collect performance data and nothing more.
Profiling Overhead
To collect profiling data, Palette uses the Profiler WebAPI. Under the hood, the API calls the V8 sampling profiler API in Chrome. A sampling profiler trades precision for lower overhead by sampling the stack at given intervals as opposed to tracing every function call like the tracing profiler used by Chrome DevTools. The profiler’s overhead is configured by setting the sampling interval when initializing Palette’s SDK . Performance tests show profiling overhead is approximately 2.0%.
Privacy
Palette only collects data relevant for performance and omits all other data. For example, Palette collects a keypress’s latency and omits the value of the key pressed.
Configuration
Notion configured Palette to collect profiles, traces, and metrics from 3% of all users. The team arrived at at 3% sample rate through experimentation — they started with a 1% sample rate and incrementally increased it until metrics and profiles were stable. Palette runs on Notion’s browser, mobile, and desktop apps. Their profiling configuration resembles the one below:
import { init, events, markers, network, vitals, profiler, paint } from "@palette.dev/browser";

init({
  key: "YOUR_CLIENT_KEY",
  // Collect click, network, performance events, and profiles
  plugins: [events(), network(), vitals(), markers(), profiler(), paint()],
});

profiler.on(
  // Run the profiler during these events:
  ["paint.click", "paint.keydown", "paint.scroll", "markers.measure", "events.load", "events.dcl"],
  // Sampling profiler configuration
  {
    sampleInterval: 10, // Sets sample interval
    maxBufferSize: 100_000, // Sets max memory overhead
  }
);
This configuration sets the profiler to automatically run during click, keypress, performance markers, and other events. Setting the sampleInterval configures the sampling profiler to run every 10ms, allowing control over the profiler’s overhead.
Improving typing responsiveness
When assisting the Notion team with using Palette to improve performance, the Palette team decided on a set of metrics we’d use for measuring typing performance and profiled code impacting these metrics. We then used the metrics and profiles, collected from end users, to improve typing responsiveness. Contrasting from the conventional approach of using Chrome DevTools to improve performance, we solely used end user performance data to direct our performance-related work. This ensured we only optimized what’s verifiably slow for end users. This approach led us to optimizing slow codepaths that didn’t surface in Chrome DevTools.
Measuring typing responsiveness
Before integrating Palette, Notion defined a set of custom internal metrics to track performance The most critical metric was typing_lag, which measures the keypress latency in Notion’s editor.
The typing_lag metric
The typing_lag metric is calculating by measuring the latency from keypress to React render. This metric got the Notion team far — it was reliable enough to measure improvements and use as the basis for alerting for regressions. But there were some shortcomings — changes to unrelated editor code would sometimes alter the internal mechanism that calculated typing_lag, making it prone to false positives for regressions. It also didn’t measure the duration of all JS work, it only measured the latency of the React render update. The biggest drawback with the metric was that it didn’t measure the perceived typing latency, but instead it measured React rendering latency which didn’t account for latency caused by the browser’s render pipeline latency, including Paint, Compose, and Layout. Perceived latency measures the latency from keypress to visual update (ie. browser paint). We later found typing_lag was almost 10x lower than the true perceived latency.

The Keydown to Paint metric
For this investigation, we decided to use Palette’s Keydown to Paint (KP) metric over typing_lag to measure Notion’s perceived typing performance. KP measures the perceived latency by measuring latency from the hardware keypress timestamp to the browser’s visual update (Paint).

KP served as the baseline for measuring the impact of all optimizations we would make.
Finding codepaths impacting typing responsiveness
Typing performance in Notion is bound by JavaScript execution, which is responsible for text editing functions, layout and positioning of content, React rendering, and more. To identify codepaths bottlenecking typing performance, we visualized code executed during the keypress handler for end users. To do this, we used Palette’s Profile Aggregates feature, which aggregates and visualizes function execution across all collected javascript profiles for a given metric, path, and app version. Profile aggregates answer questions such as “Which functions were running during KP on the home page on version 1.0.0 of my app?” and it shows the resulting functions by percentage of time on the stack.
Primer: Profile Aggregates and Flamegraphs
Profile Aggregates summarize function execution time across end users’ sessions and visualize them as a flamegraph. It sorts functions by execution time and compares changes to function execution time. It is similar to the Chrome DevTools profiler, but is instead powered by profiles from your end users' sessions.
Optimization 1: Removing Unnecessary Polyfills
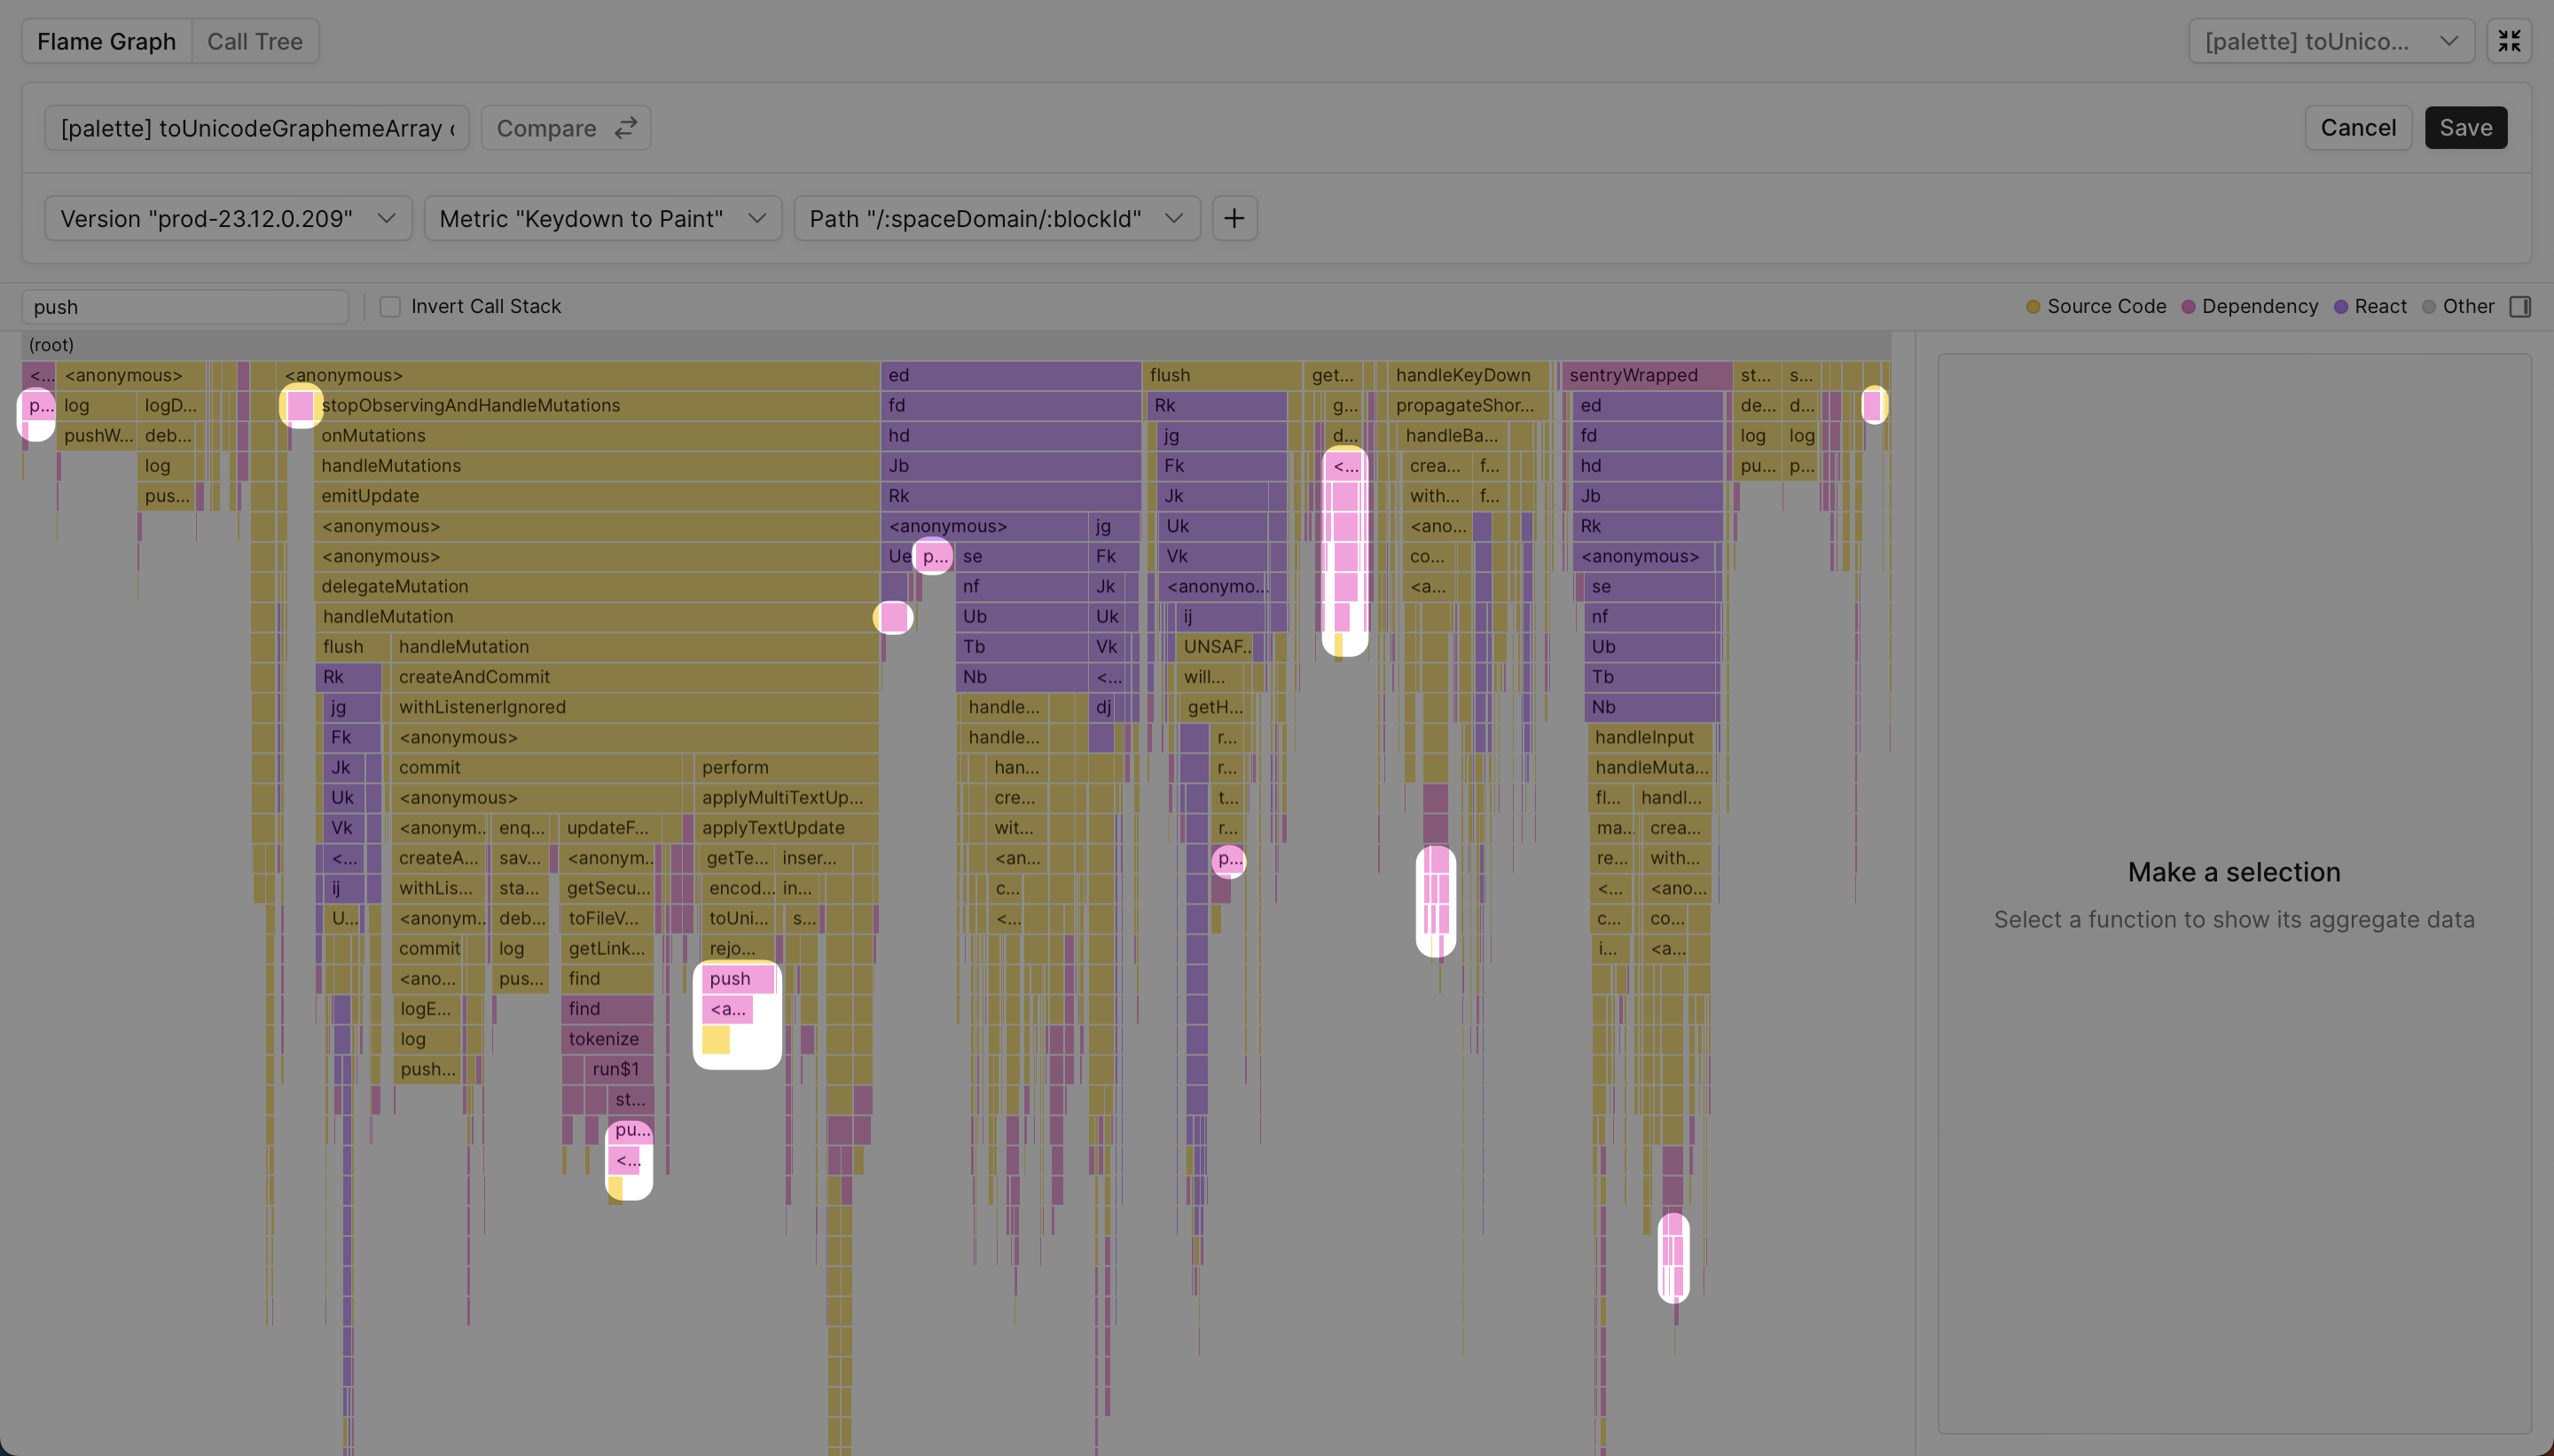
When inspecting the Profile Aggregate for KP, we found many native functions were unexpectedly polyfilled, and in turn were impacting typing performance. Polyfilled functions are significantly slower than their equivalent native implementations. We found critical JS APIs were polyfilled, including Array and Function. When aggregating against KP we saw a number of function stacks using a polyfill for Array.prototype.push:
To understand the impact further, we looked at individual user sessions, using Palette’s User Sessions feature, and saw push in the flush stack, which runs during the critical rendering path for certain Notion components:
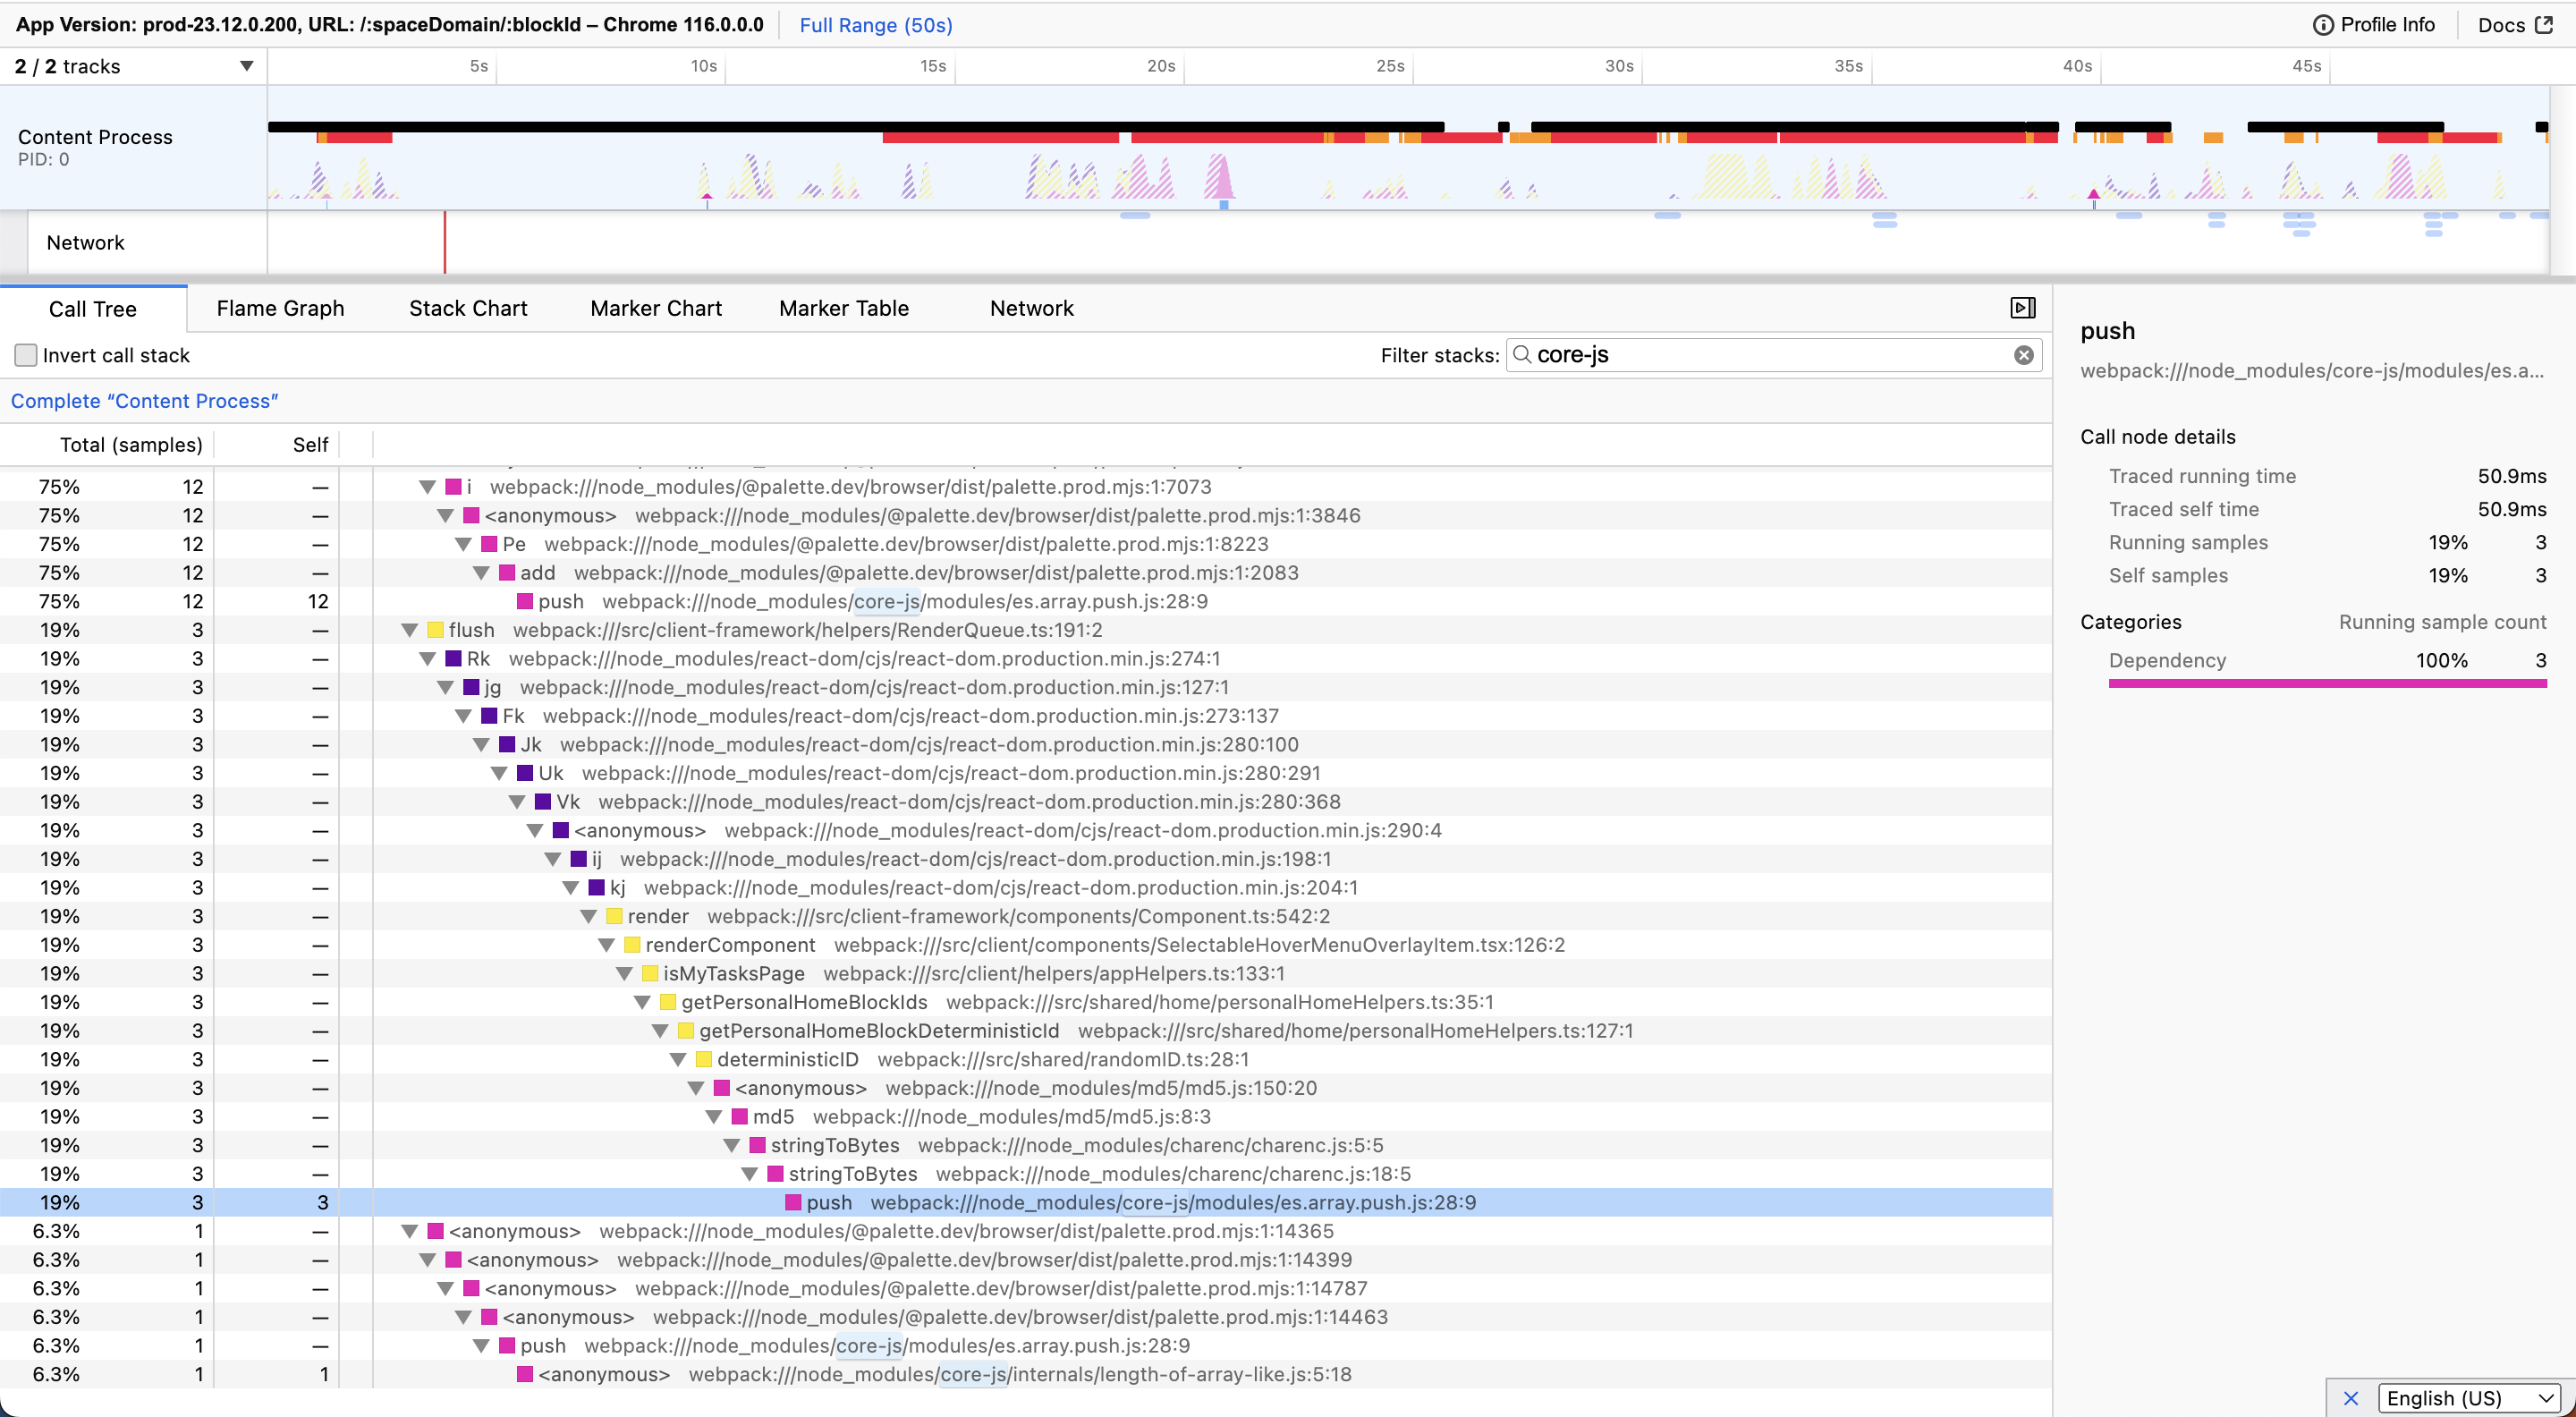
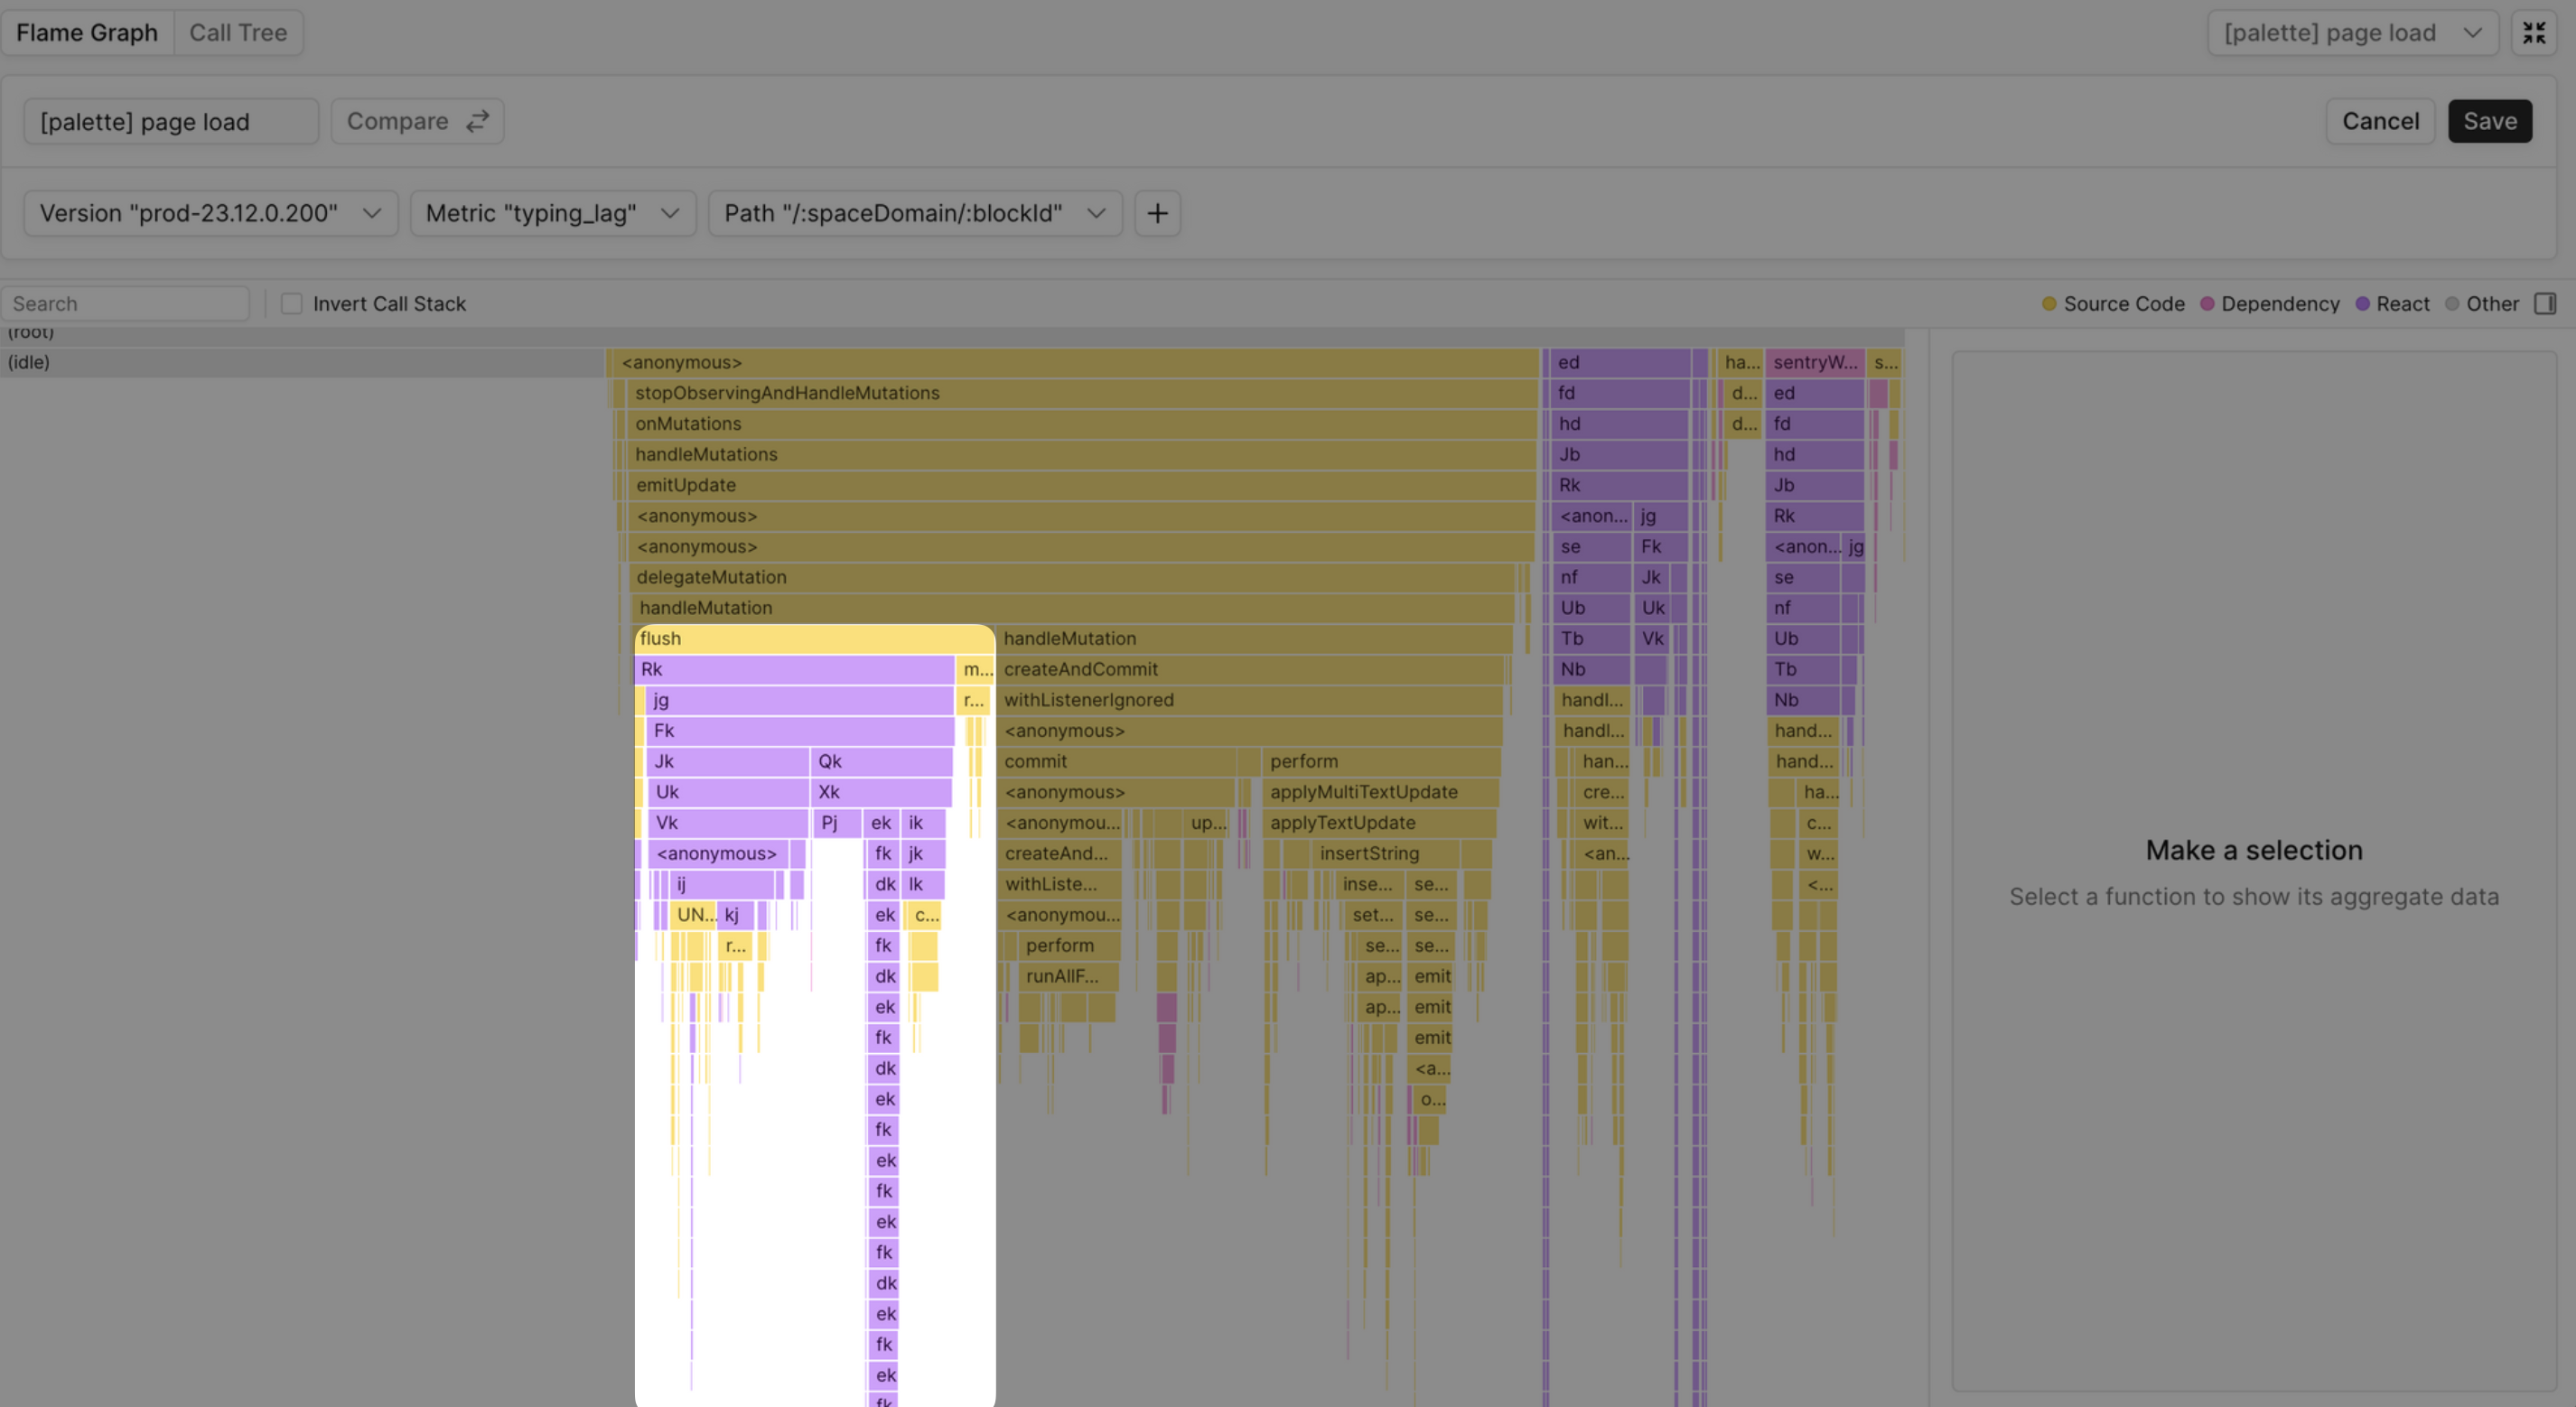
These stacks (flush, handleMutation, handleKeyDown) are in the critical rendering path and use the polyfilled version of push.
Aggregates help us understand that the overhead of push is a “death by a thousand papercuts” type of scenario. Given Notion only supports modern browsers, the push polyfill can be dropped.
Optimization 2: Memoizing Expensive Cookie Parsing
Upon further inspection of the Profile Aggregate for KP, we found cookie functionality was unexpectedly impacting typing performance and that two functions were mainly responsible getCookieWithoutPermissionCheck and get:

We found these same functions were also blocking other metrics like LongTask and CTP:
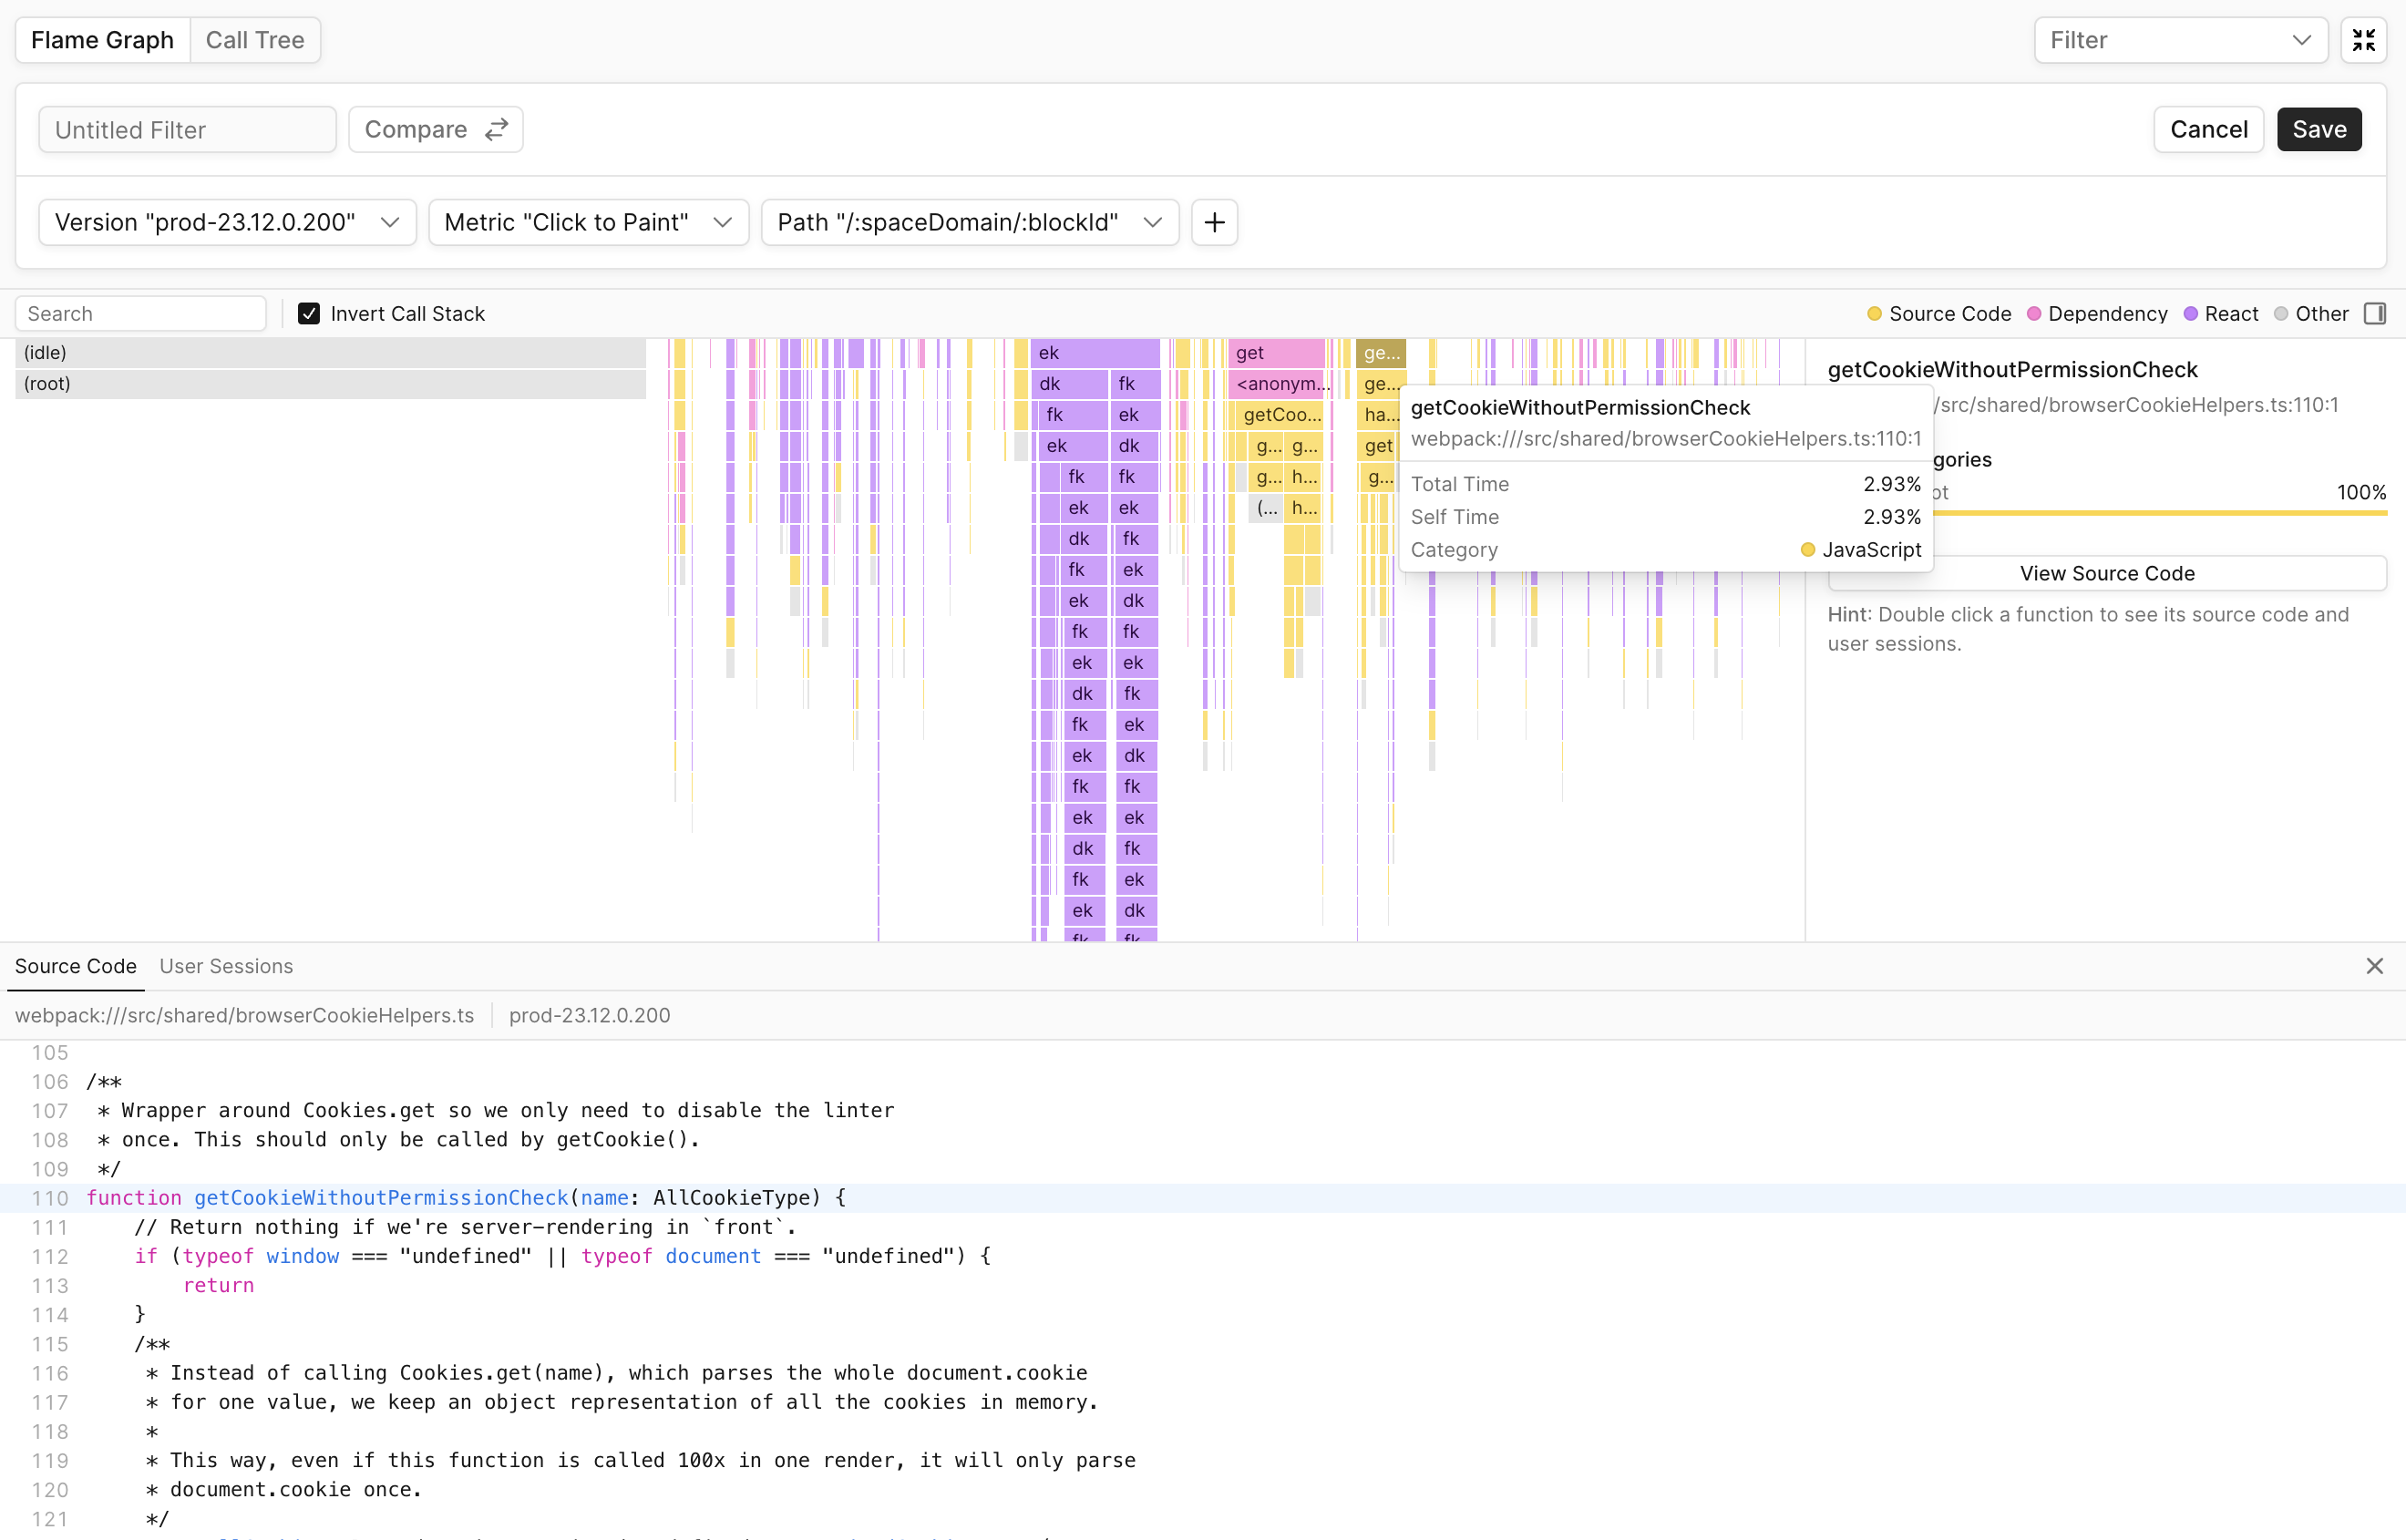
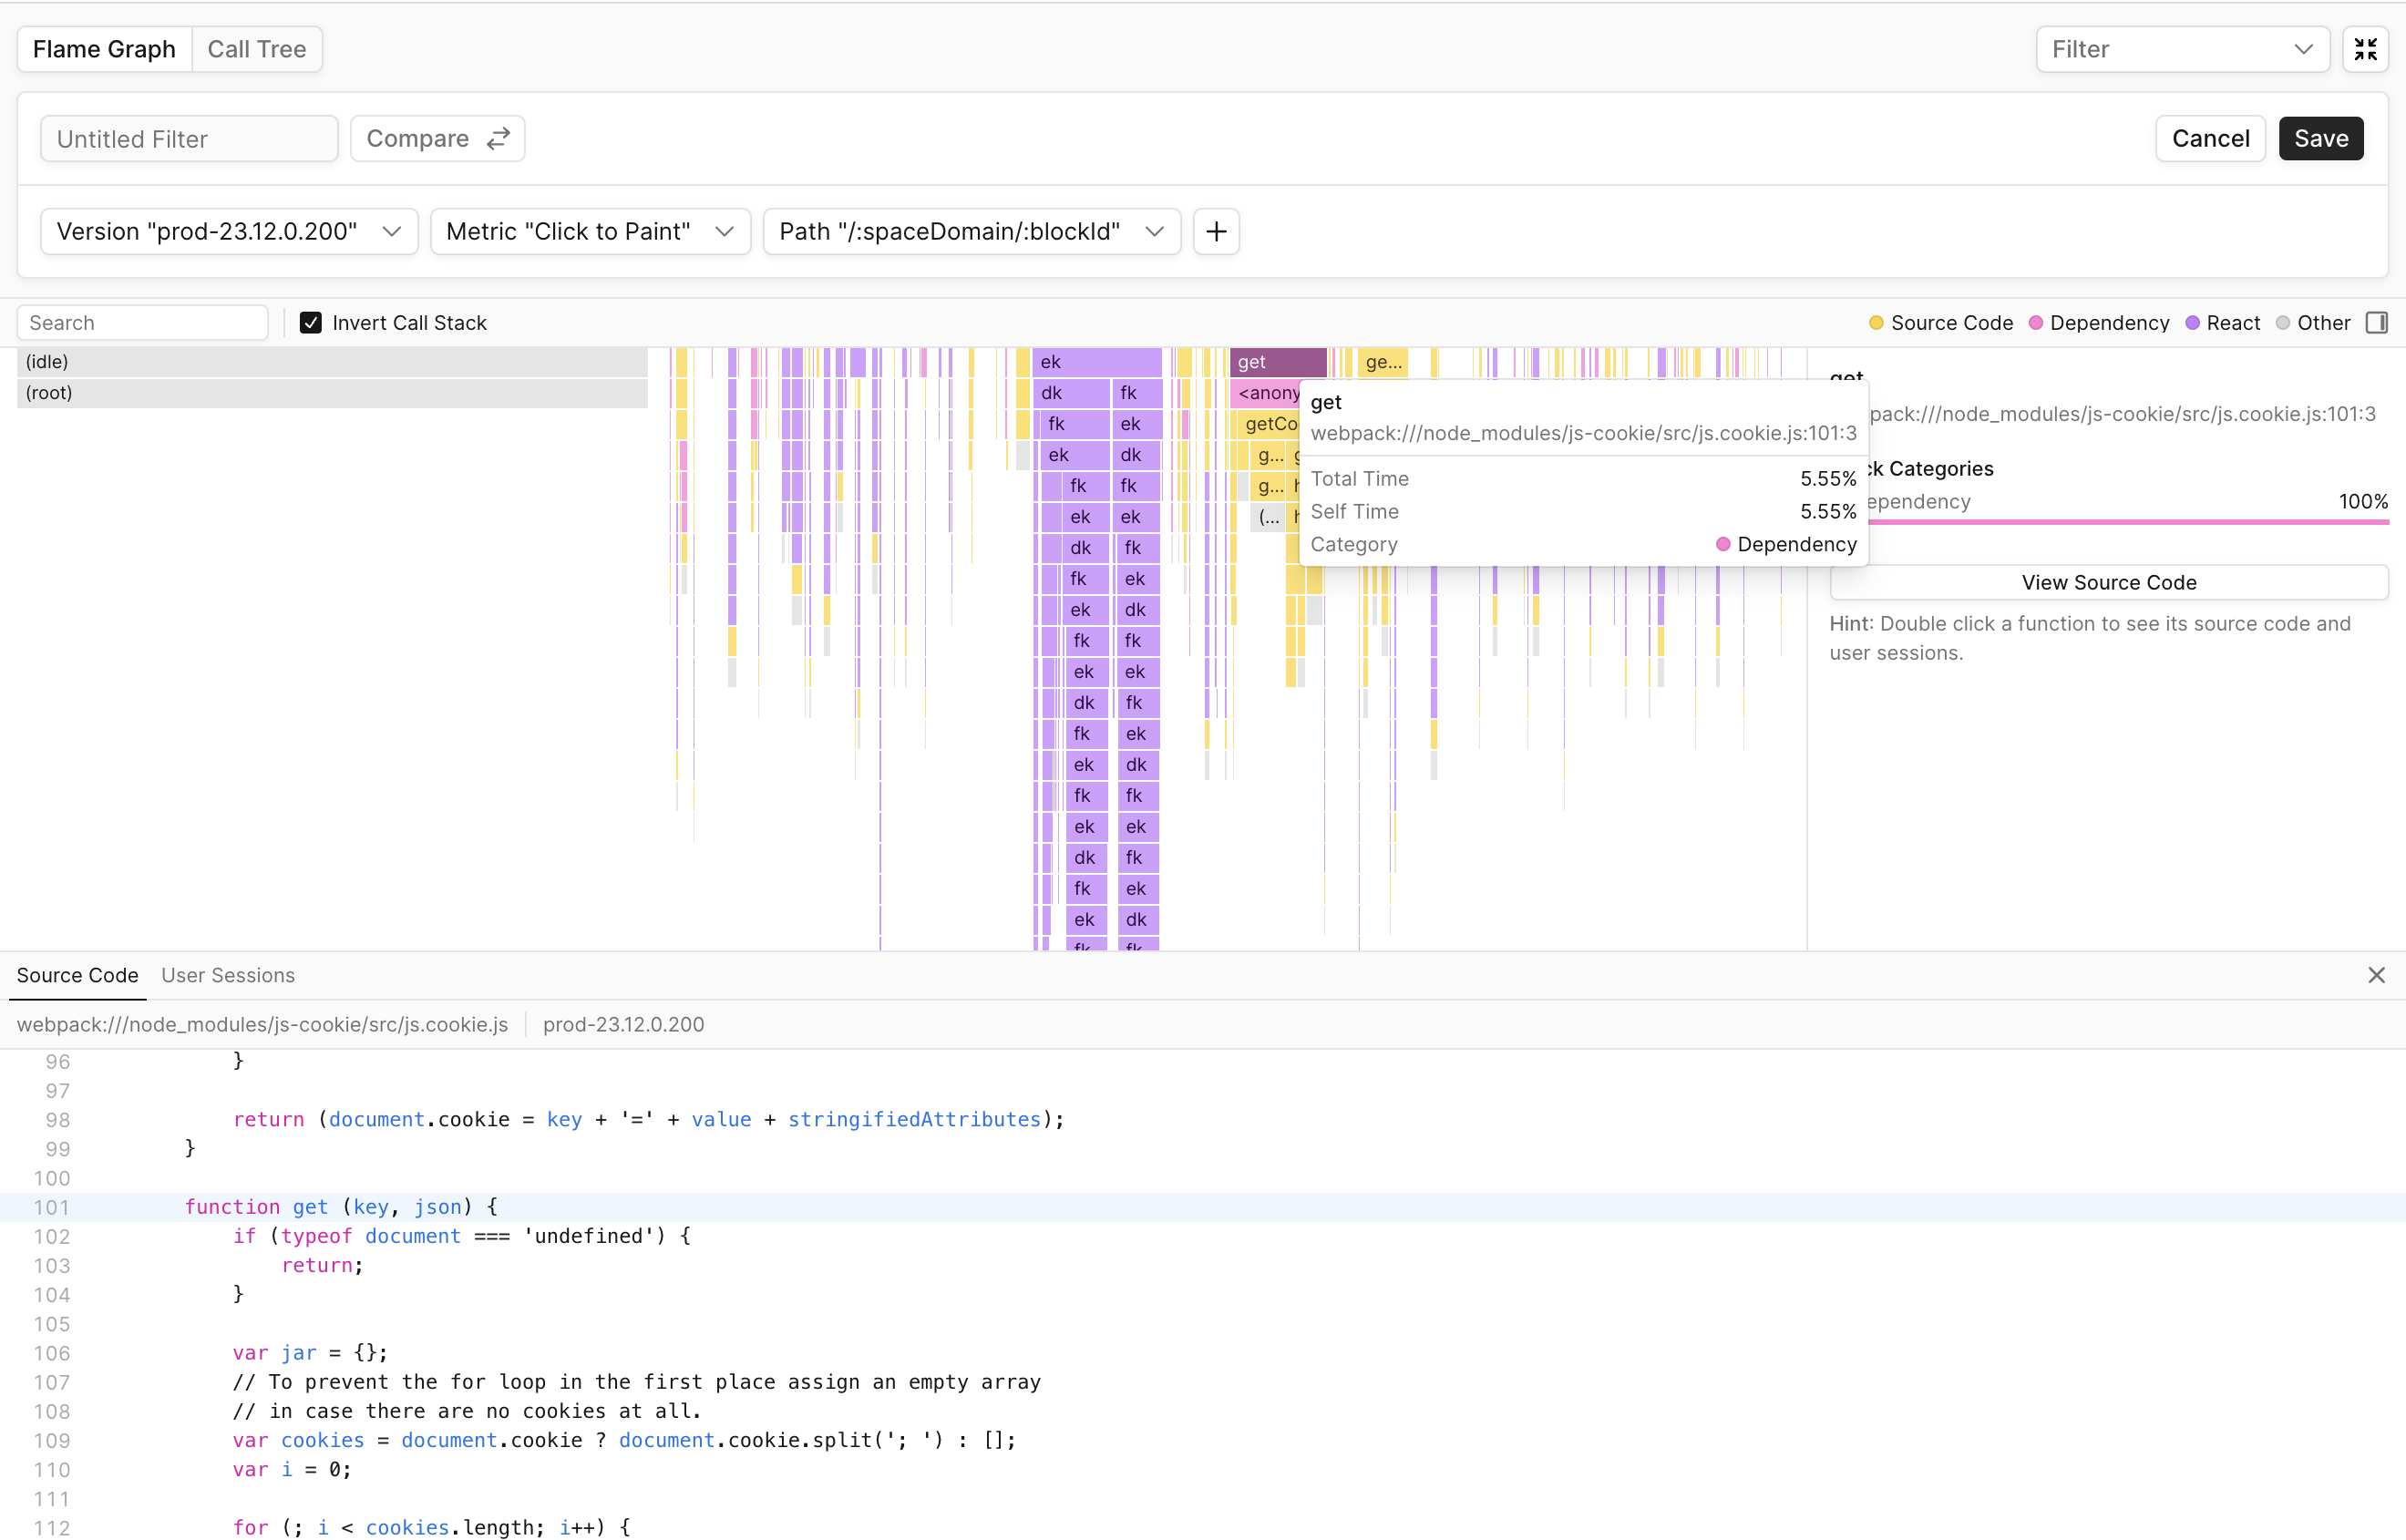
Both of these functions are responsible for cookie functionality, so we decided to start investigating the overall impact of cookie functionality on Notion typing performance.
After inspecting individual user sessions where KP was slow and filtering call stacks including get, we saw the Notion editor frequently accessing cookie data, sometimes multiple times within a single frame.

Browser cookies, accessed by document.cookie, are stored as strings as opposed objects, so they must be reparsed on every call to cookie.get. The cookie library had no caching mechanisms of its own, making cookie.get an expensive API to invoke. Palette’s source code preview shows us the parsing logic for get:
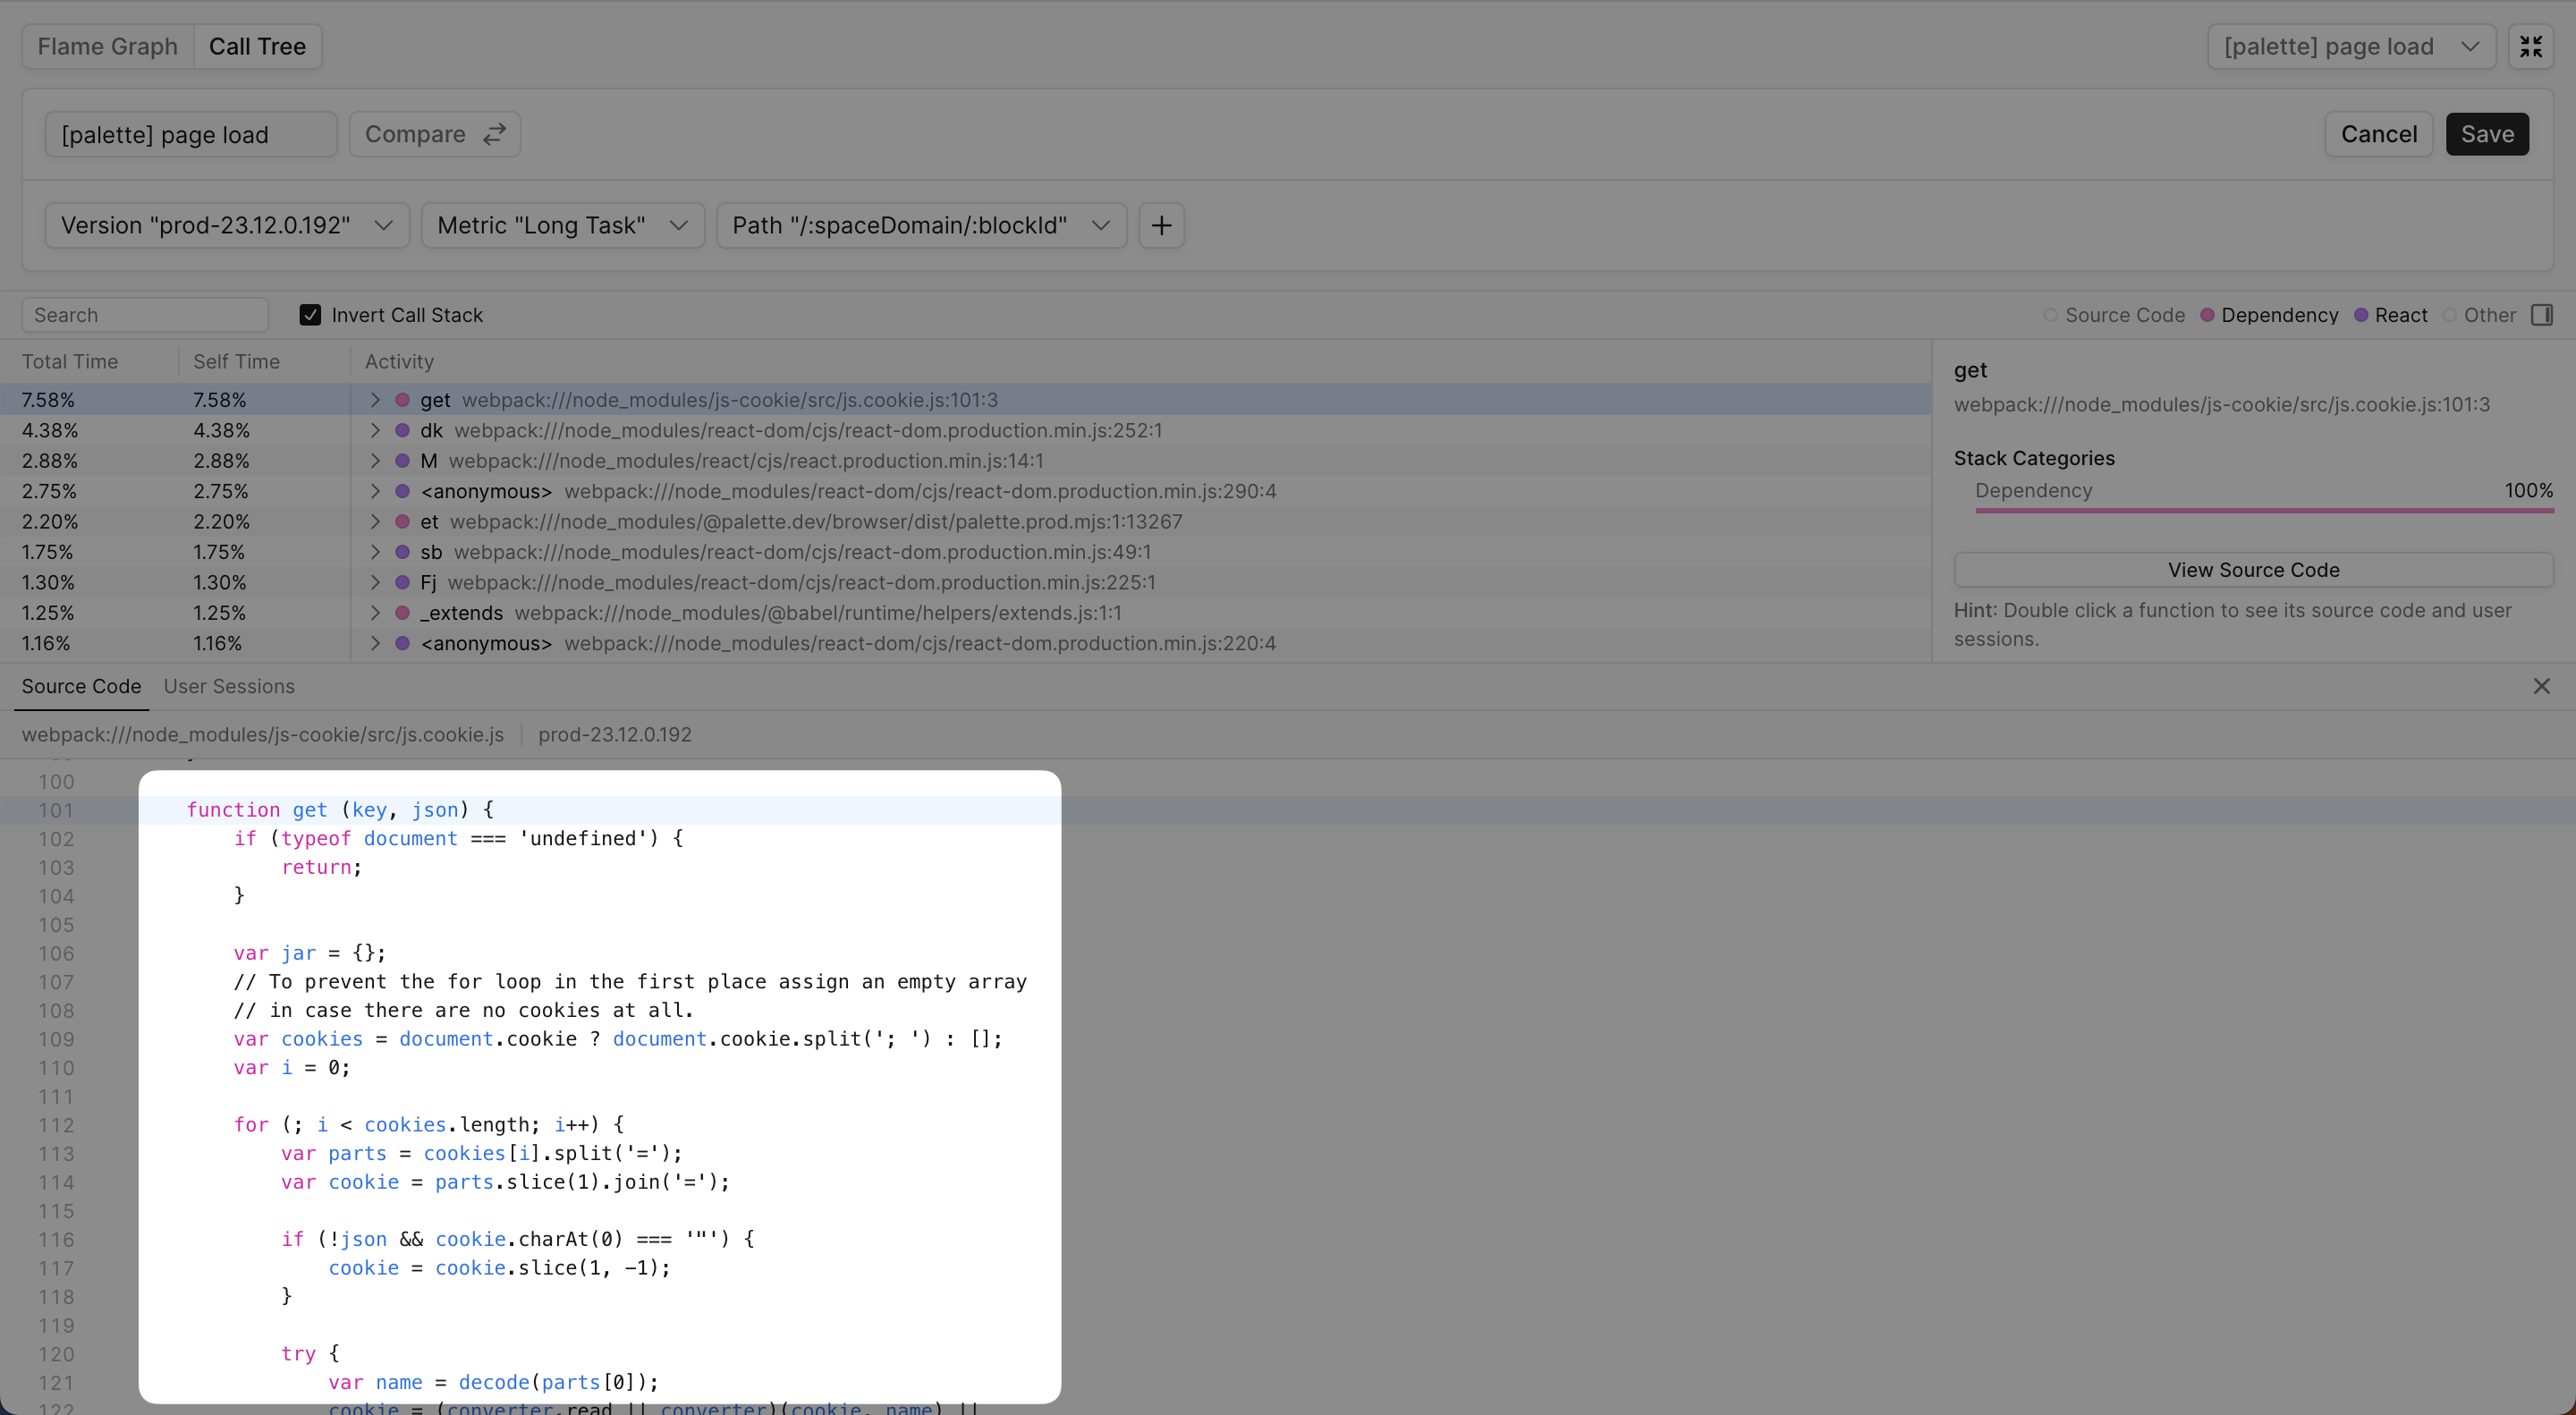
We realized that by memoizing calls to avoid parsing during the critical rendering path, we would noticeably improve typing performance.
Measuring typing performance improvements
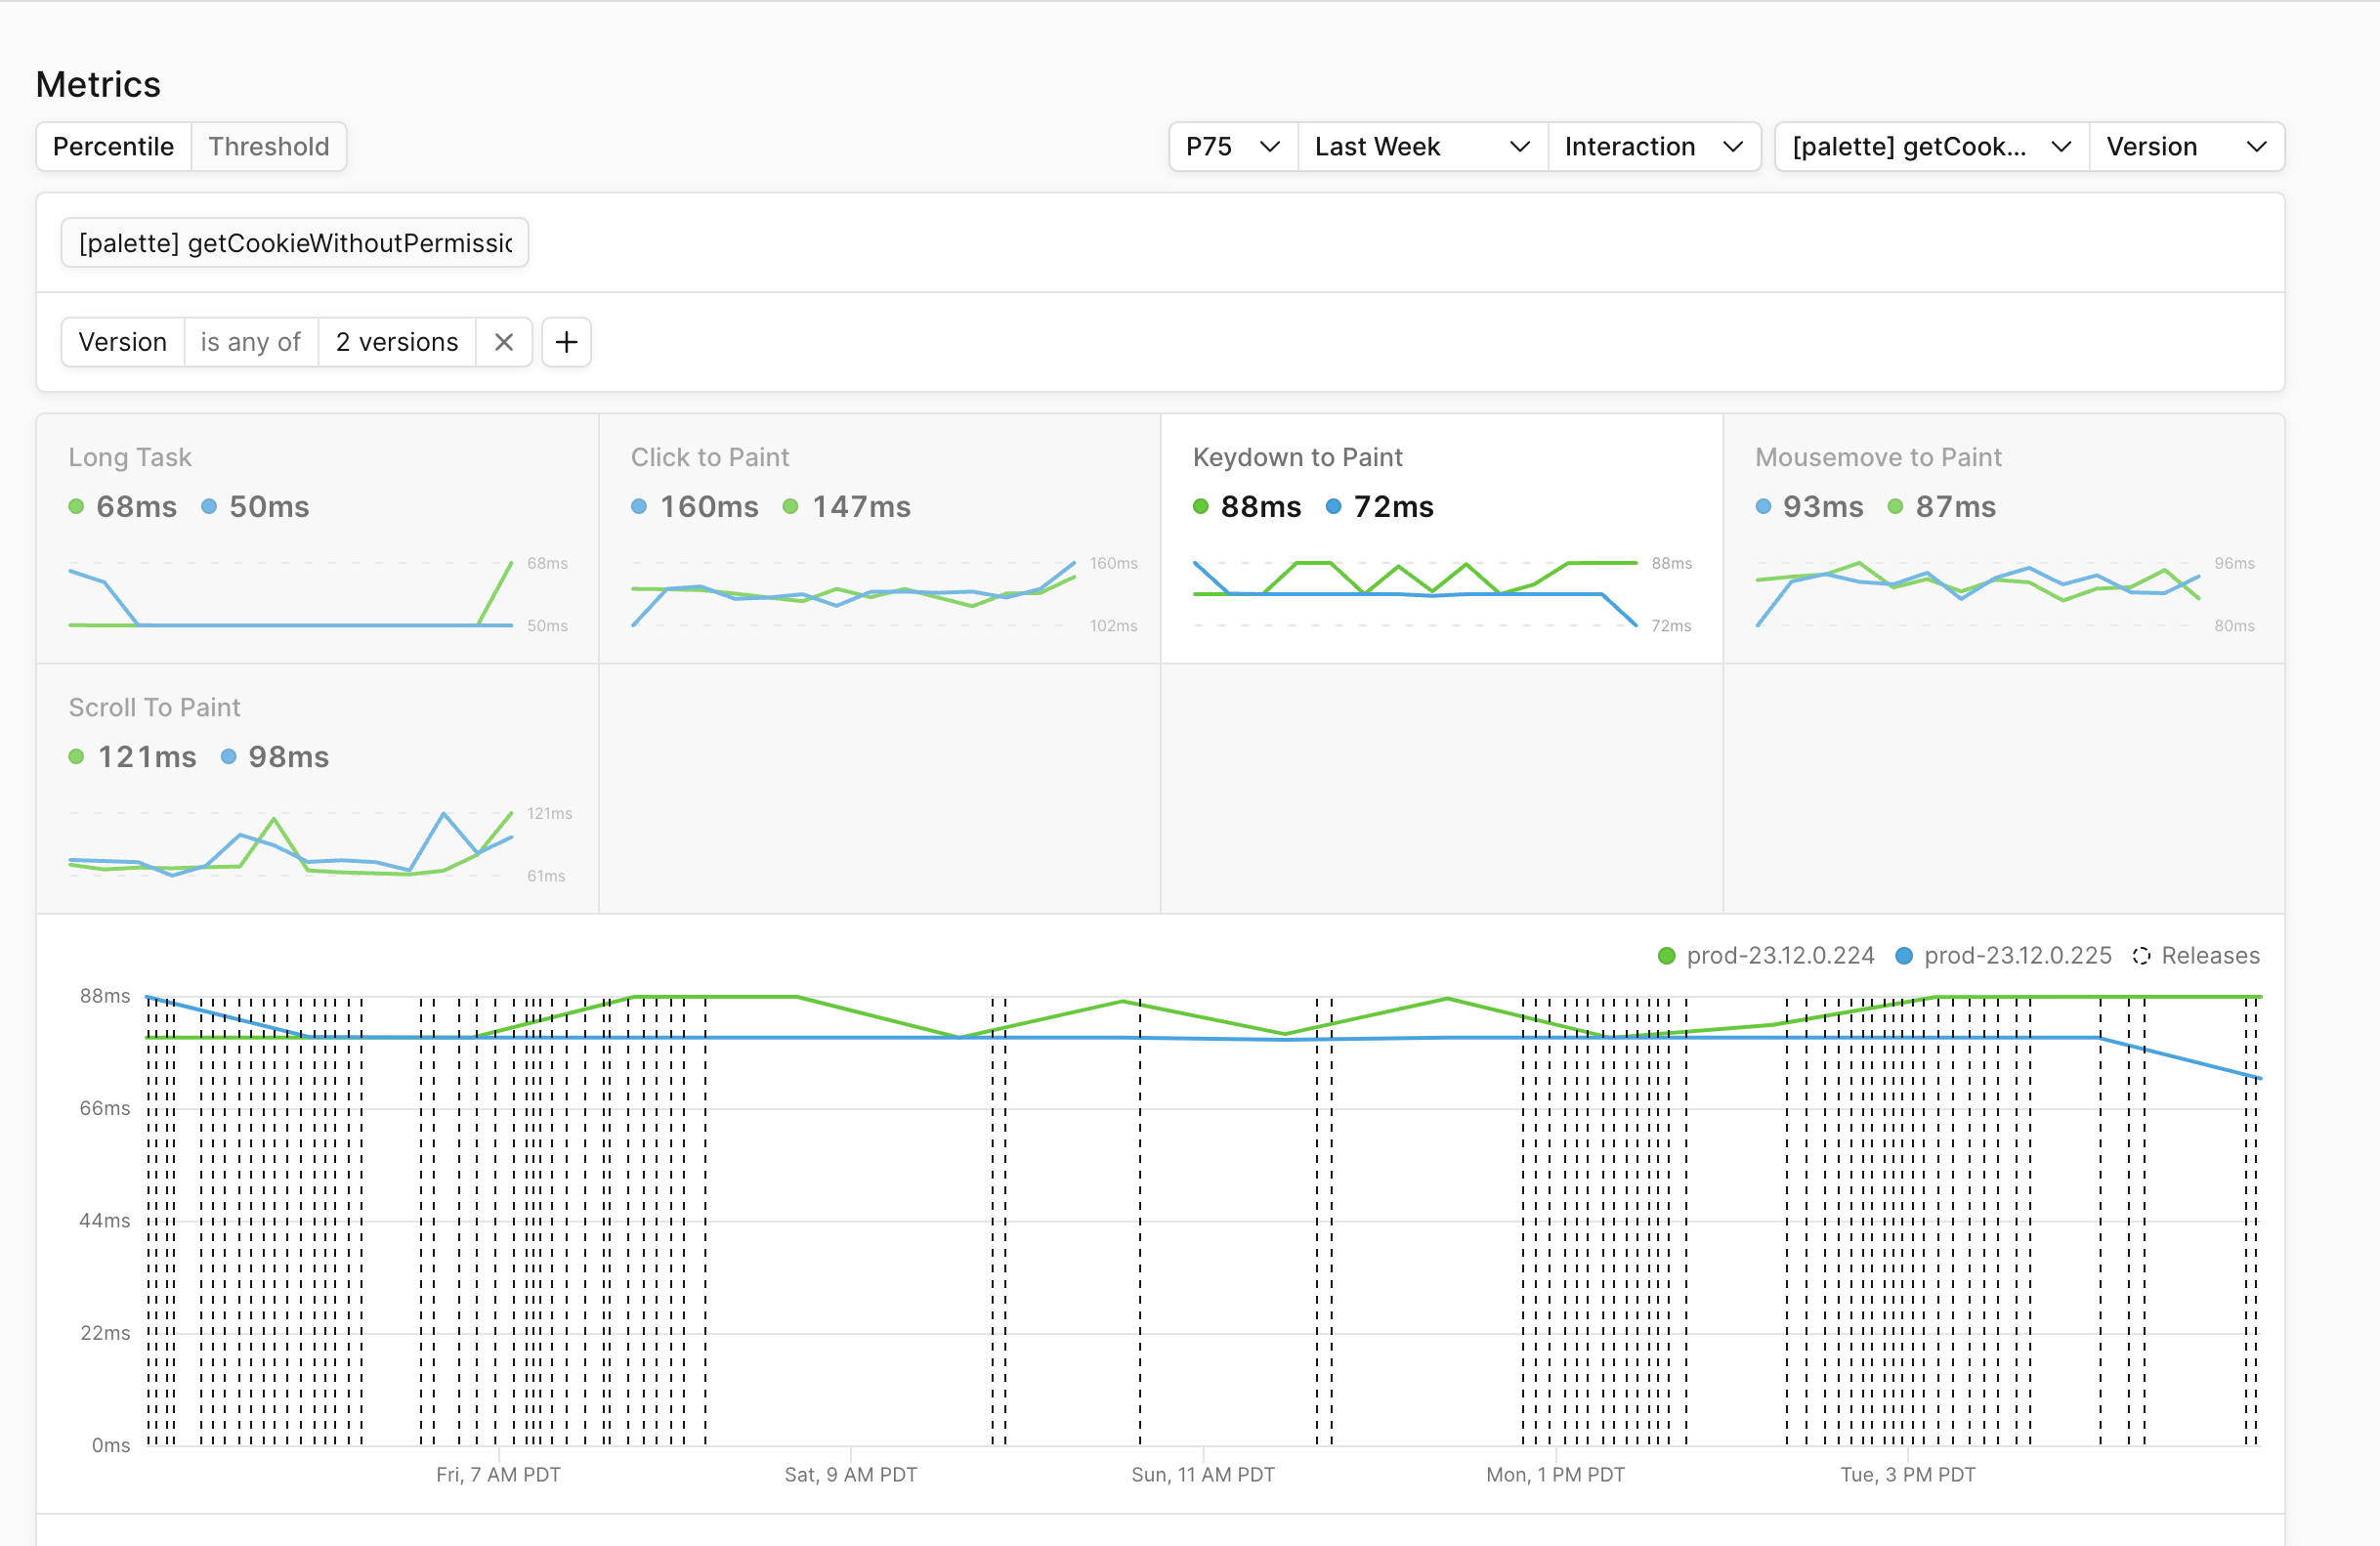
After removing the polyfills and memoizing the cookie parsing, we saw a 15% reduction in p75 KP latency.
Cookie Memoization
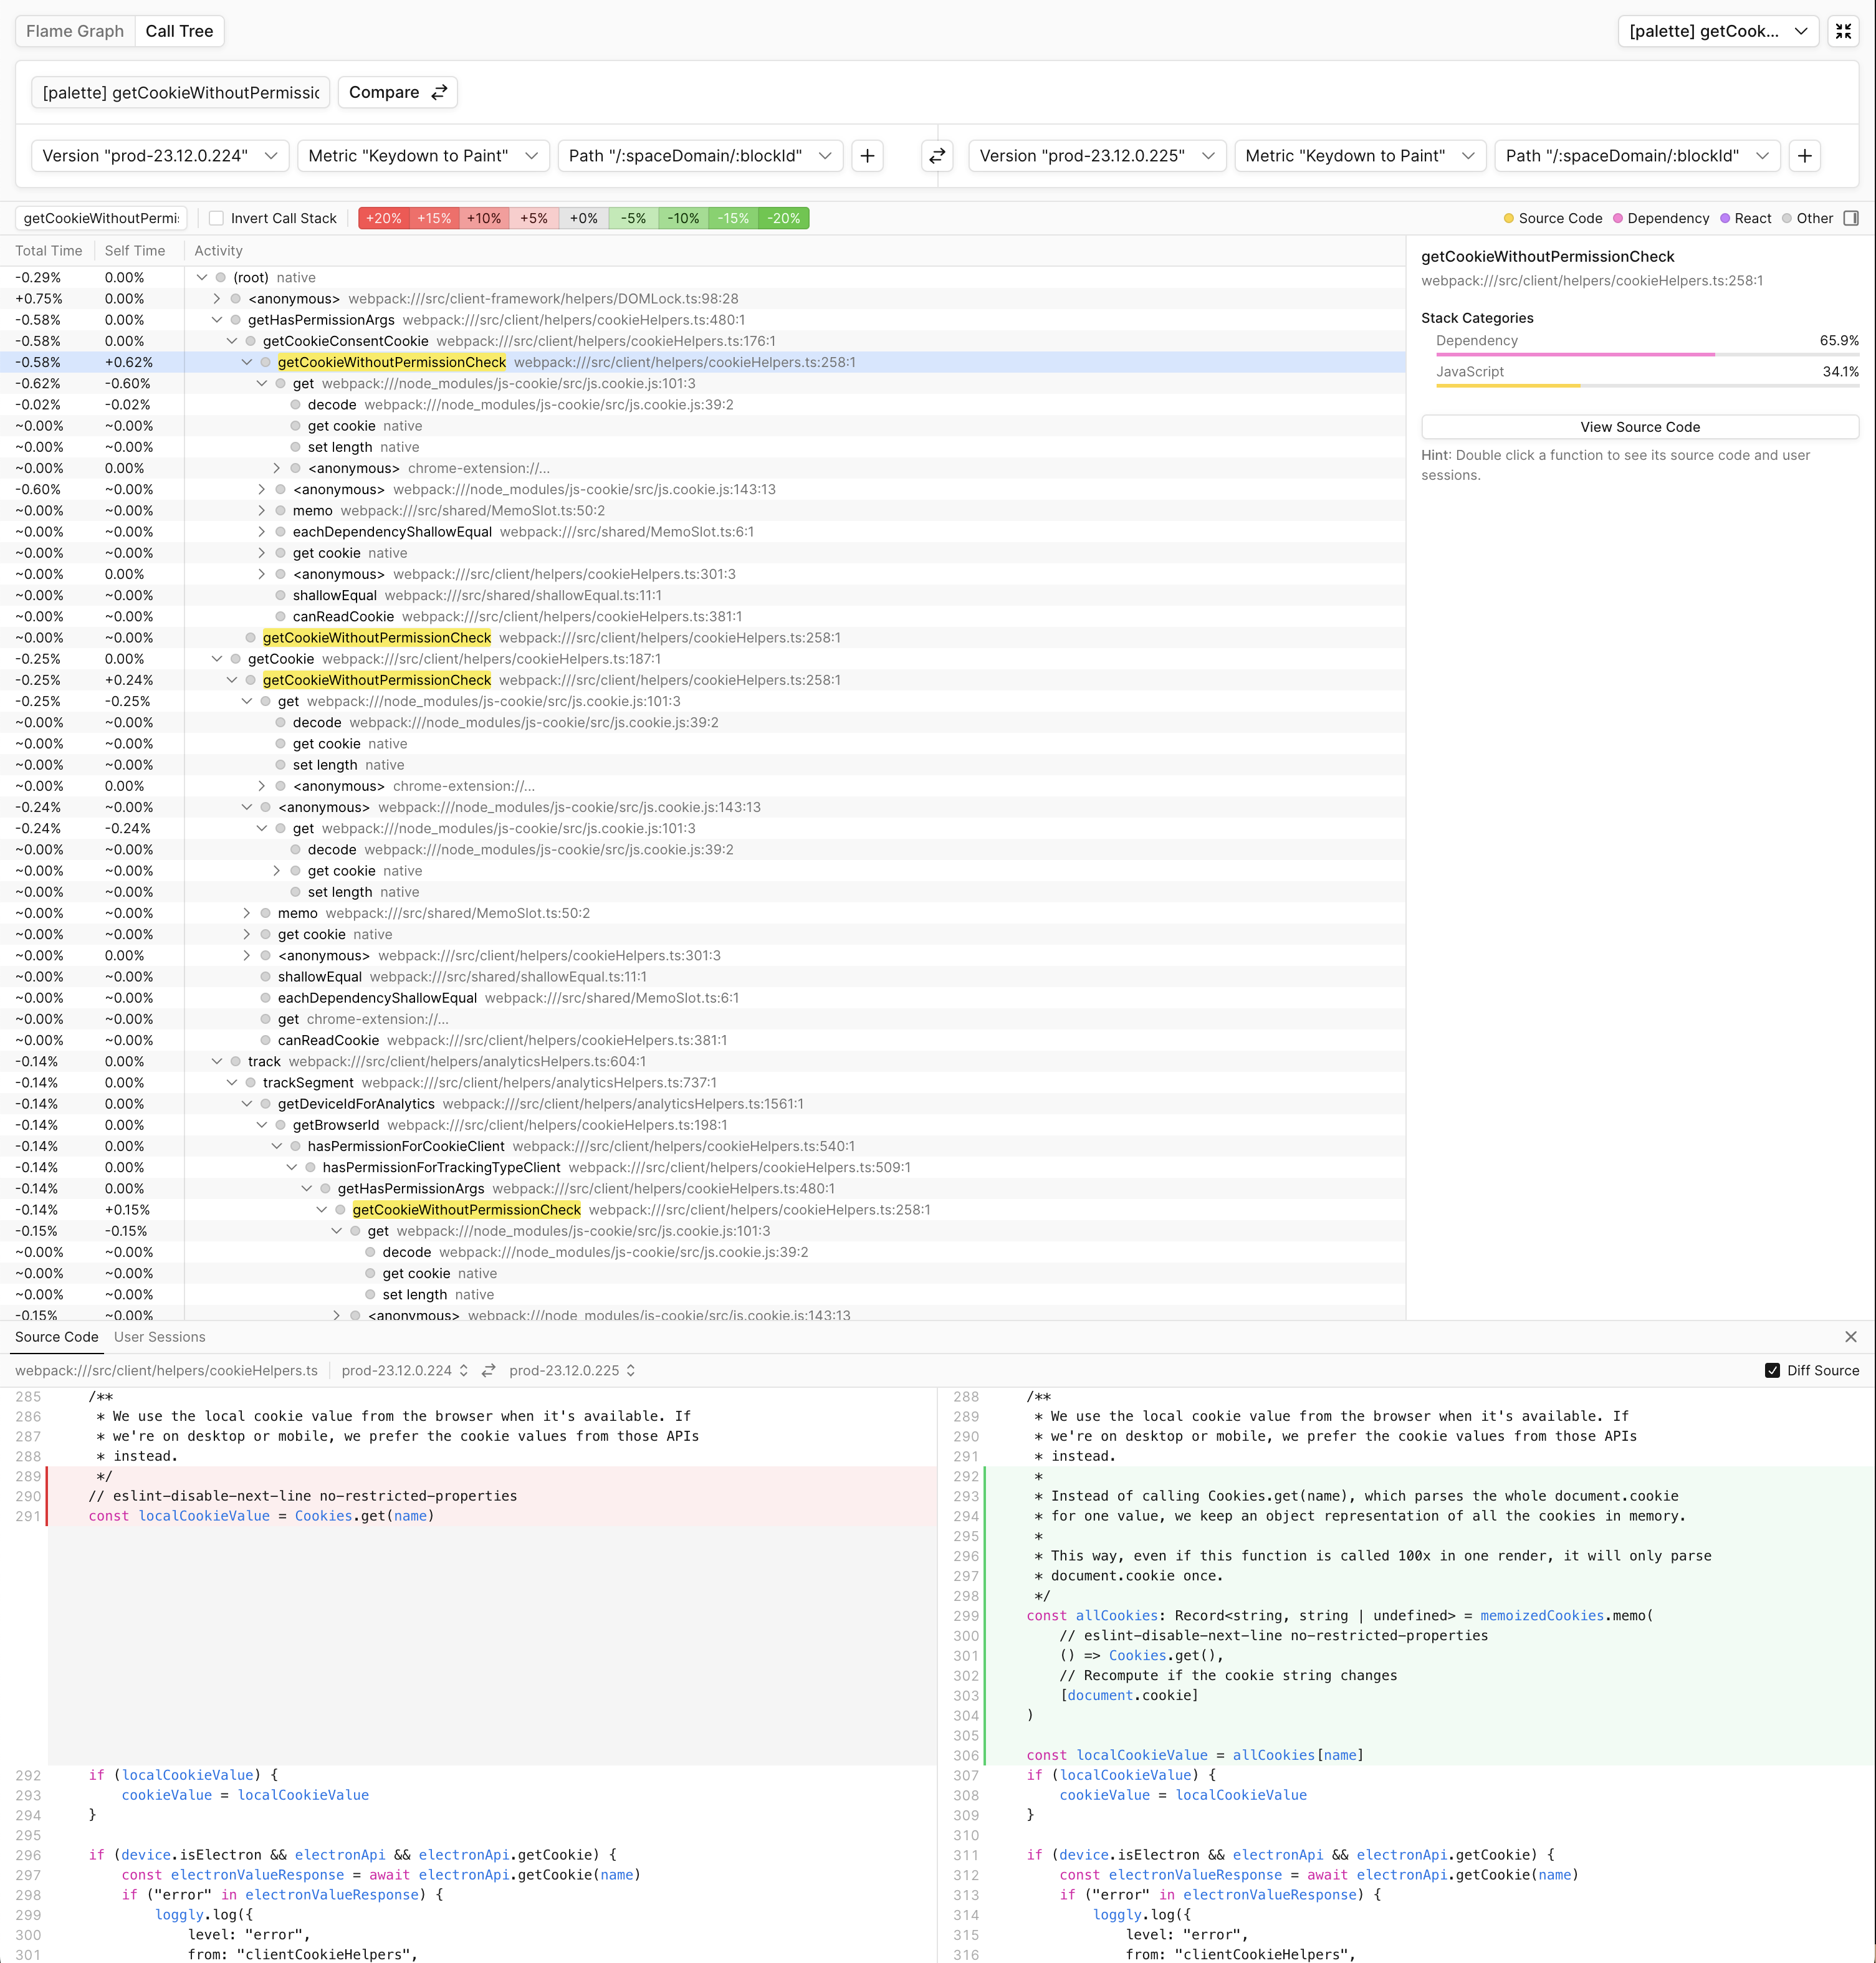
After memoizing cookie.get we see a drop in total time for getCookieWithoutPermissionCheck across multiple stacks:
And when monitoring the p75 of KP we see a reduction by 15%:
A longer term solution could be to use the CookieStore API, which delegates cookie parsing and serialization to the browser.
Identifying regressions to typing latency
While the Notion team made significant improvements to typing performance over time, adding new features and refactoring regressed performance.
Notion faced two main challenges when fixing load and typing regressions:
- Fixing regressions was time consuming. Reproducing regressions often took weeks, if not months. Regressions would go unresolved and the team would need to baseline their metrics to the regressed state. Engineers would manually reproduce slow user experiences using the Chrome DevTools profiler against an end user’s Notion document upon user consent. This method was time consuming and unable to find the root cause of performance regressions.
- Regressions were difficult to attribute. Multiple teams would ship code changes that regressed typing and load performance. Pull requests for new releases of the app would often merge over 100 commits owned across multiple teams. Attributing the regression to a specific team was often guesswork. The team would revert changes to try to improve a metric without it having any effect. If reverting changes didn’t work, the team would repeatedly revert changes until the metric returned to normal or baseline their metrics to the regressed value.
One of Notion’s goals when integrating Palette was solving these performance challenges. Palette’s Profile Aggregates Comparison addresses these challenges by visualizing increases and decreases in function total time between two flame graphs. Notion’s engineers use Palette’s Profile Aggregates Comparison feature to maintain typing performance by catching regressions to performance.
During an incident in September of 2023, the team saw a 10% regression to the 95th percentile of typing_lag and that percentiles lower than the 80th percentile were not impacted. When investigating the regression, the team wanted to understand which functions, which ran during typing_lag, increased in total time between versions .213 and .215. By setting the Metric field to typing_lag, the Version fields to .213 and .215, and the Path field to the Notion document path, the team isolated functions that increased in total time. The image below shows the comparison Profile Aggregate, colored to indicate changes in function total time:
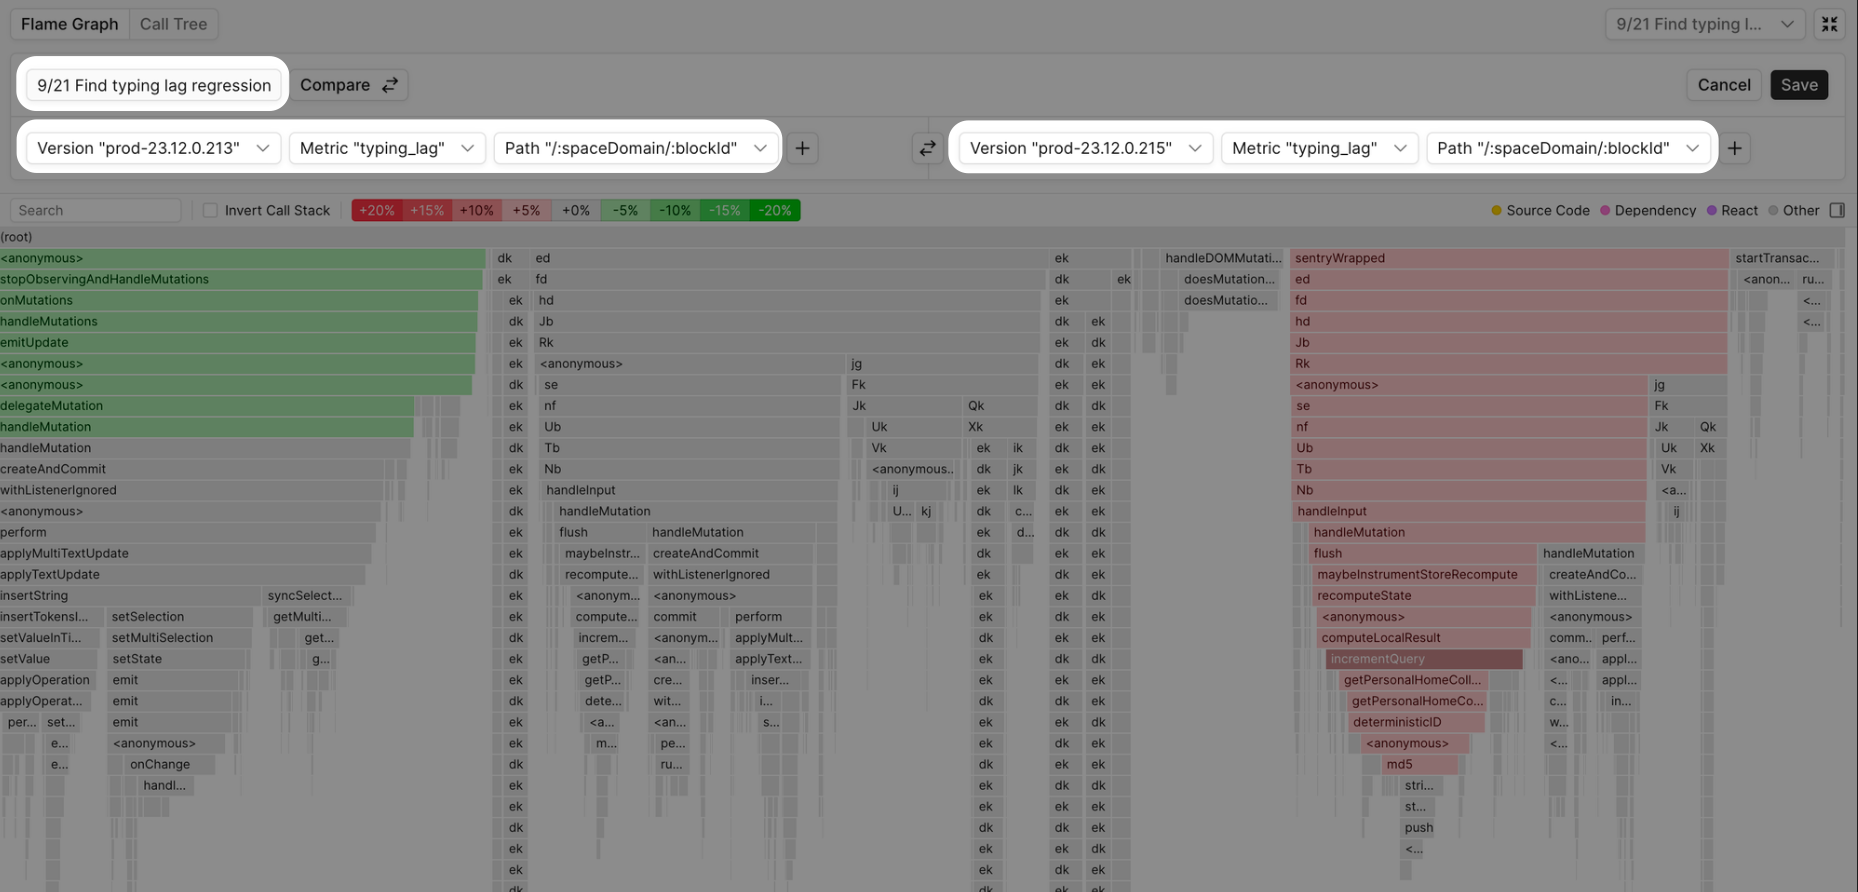
The Compare colorings indicate the following:
- Green Functions: Reduction in total time for the right aggregate relative to the left aggregate.
- Red Functions: Increase in total time for the right aggregate relative to the left aggregate.
- Gray Functions: Negligible delta (
<1%) in total time for the right aggregate relative to the left aggregate.
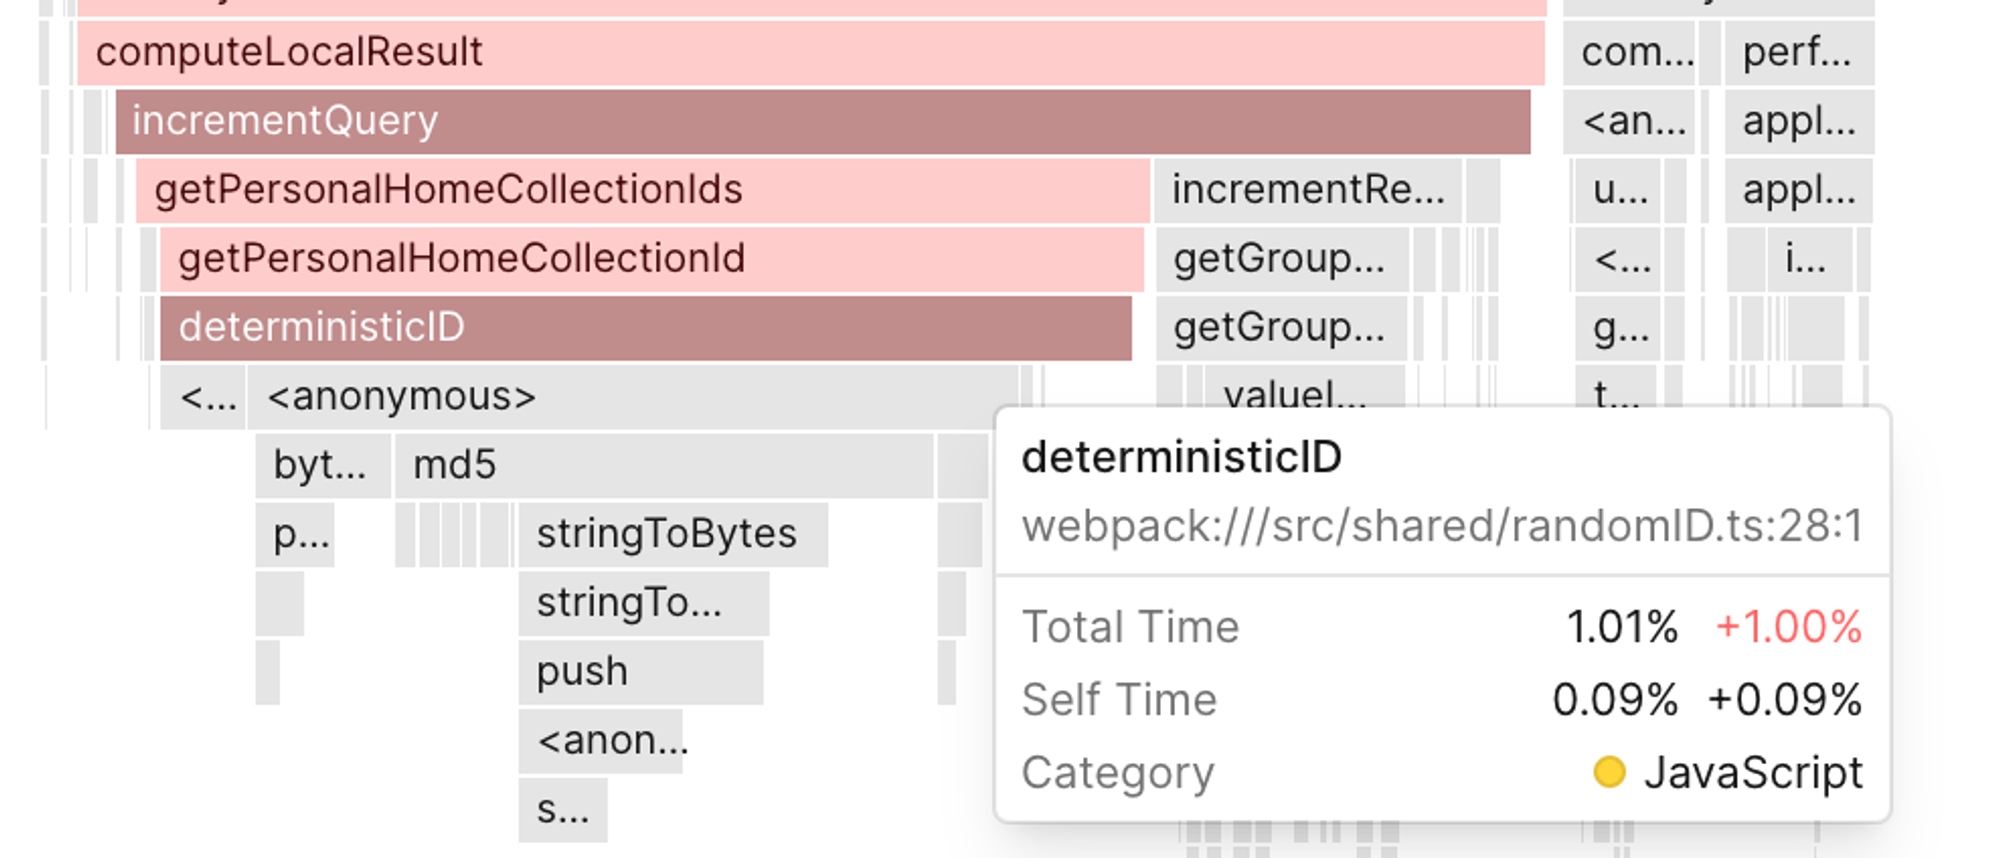
When inspecting the function stack that increased in total time, we see its total time increased by 1% between versions .213 and .215:
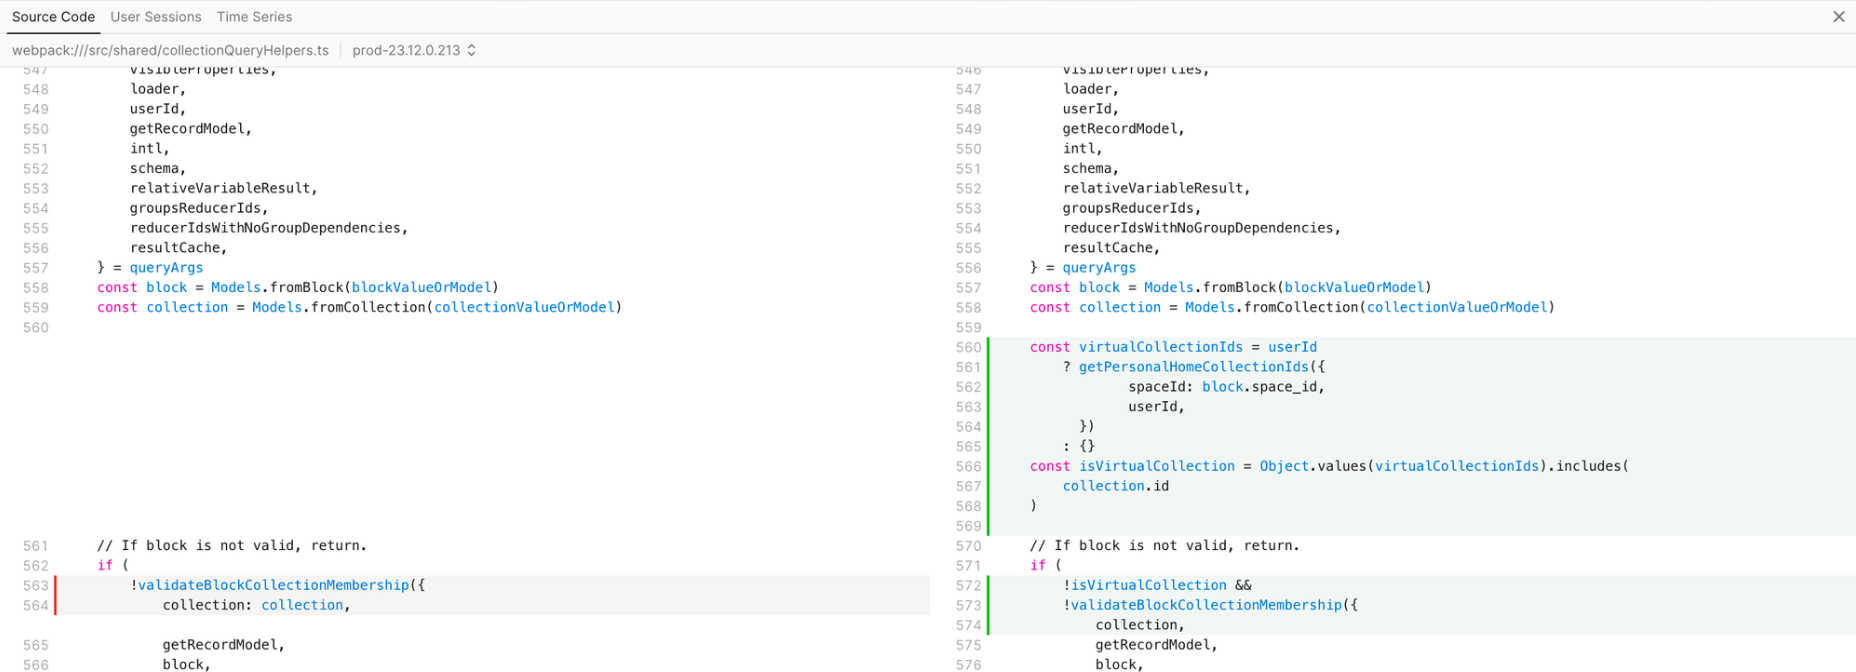
When selecting the function that increased in total time, we see the source code diff for the added code that regressed the function deterministicId between versions .213 and .215:
Investigating higher percentiles
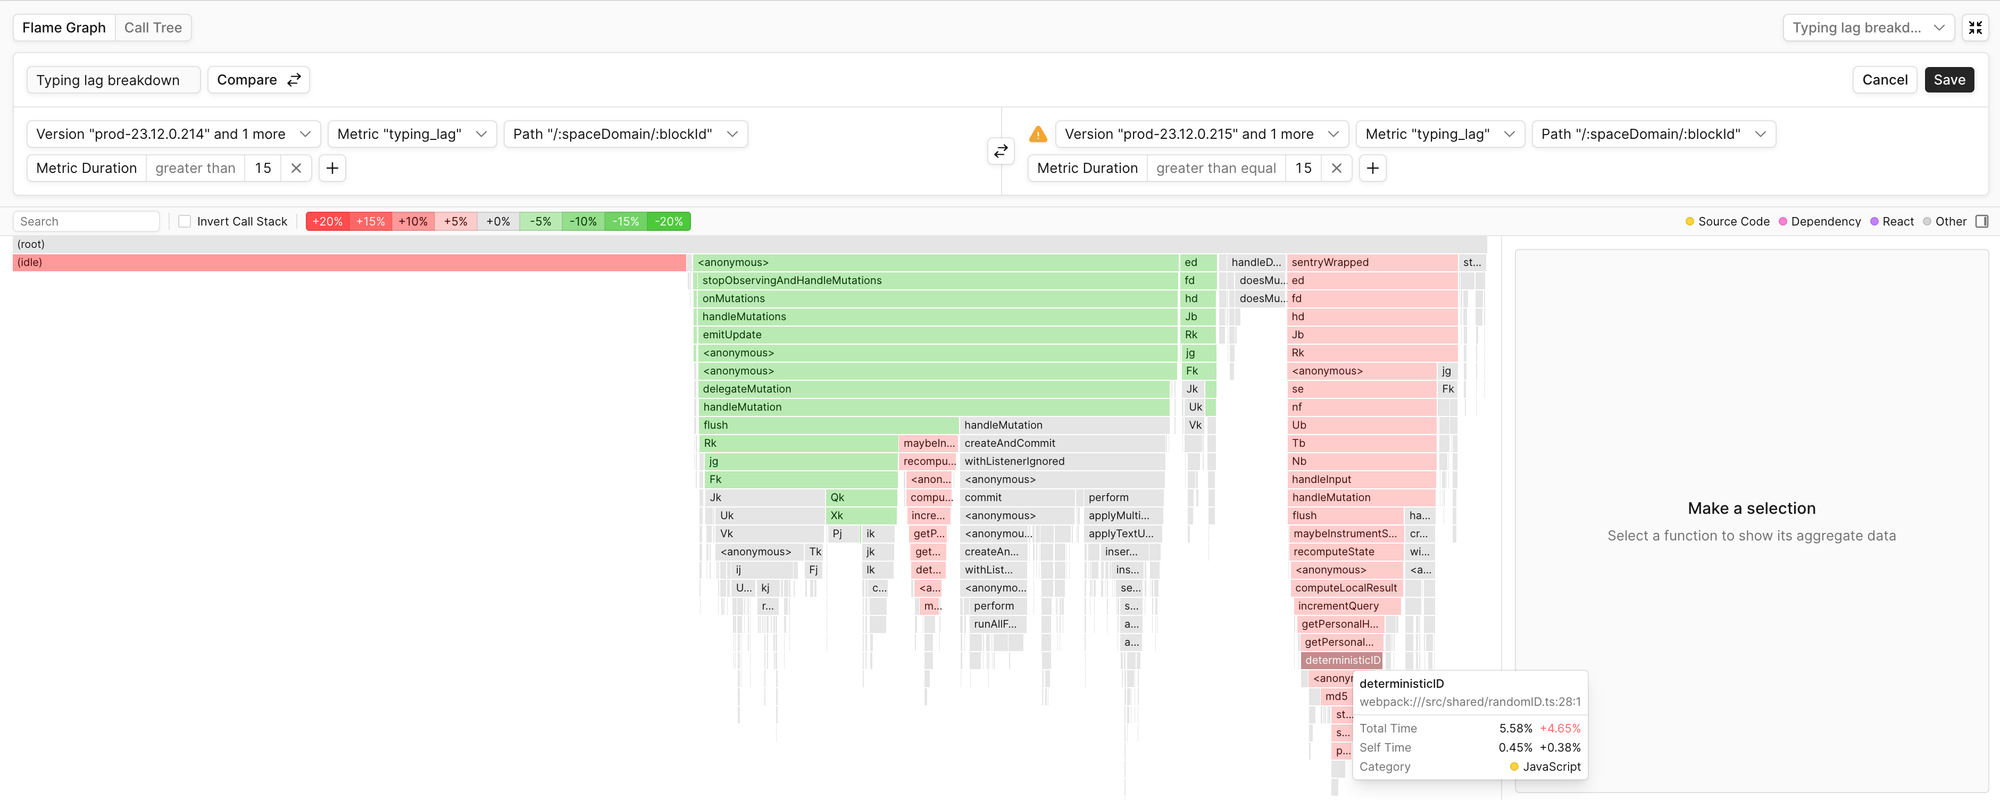
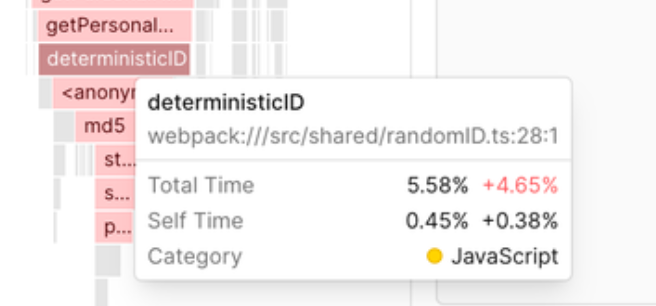
The regression disproportionately affected higher percentiles of typing_lag, meaning the slowest typing experiences regressed disproportionately more than the average. To understand the performance regression’s impact on the p80 of typing_lag (15ms), we set the Metric Duration field to 15. We then saw determinsticId total time increased by 4.65%, up from 1.00%, between versions .213 and .215:
Validating the fix to the regression
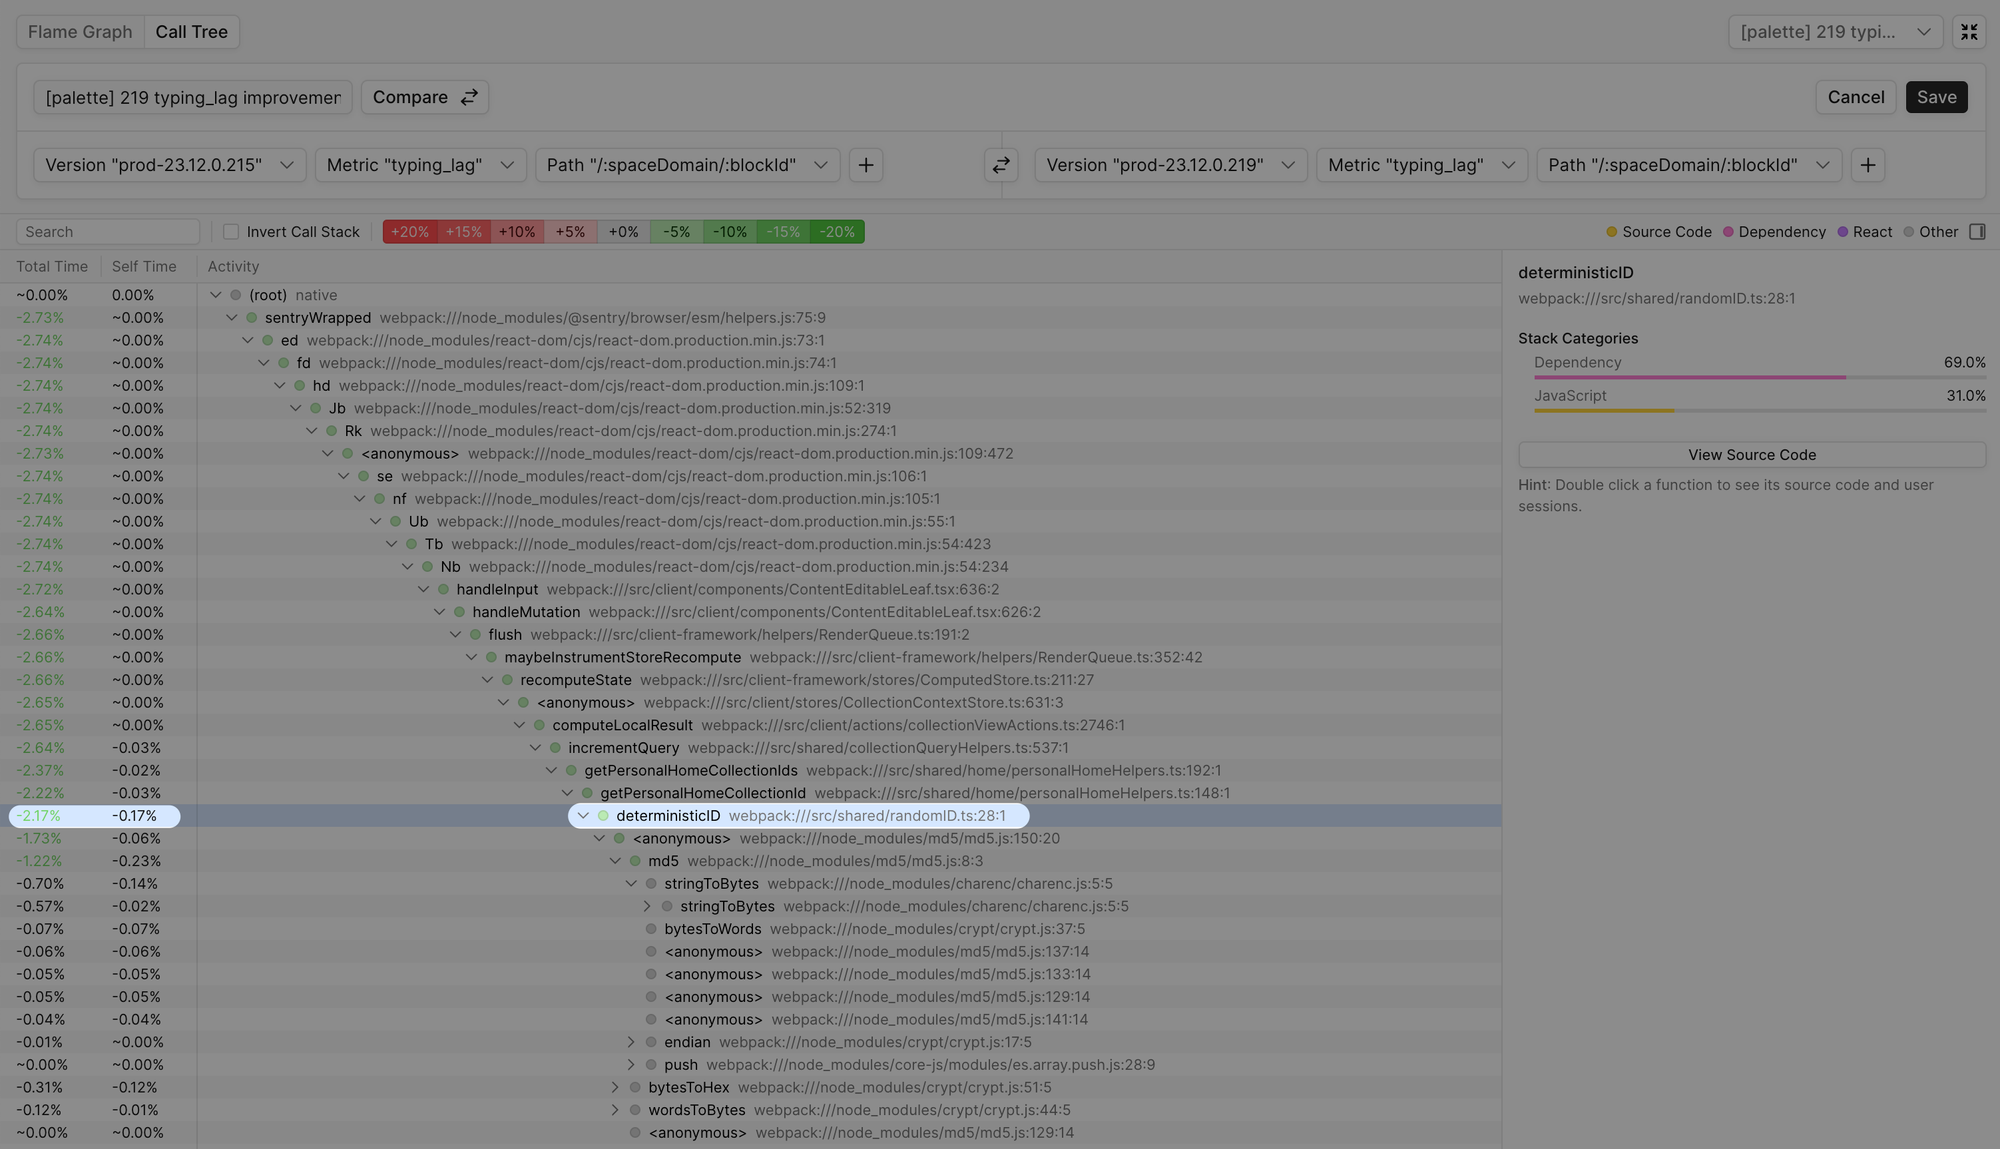
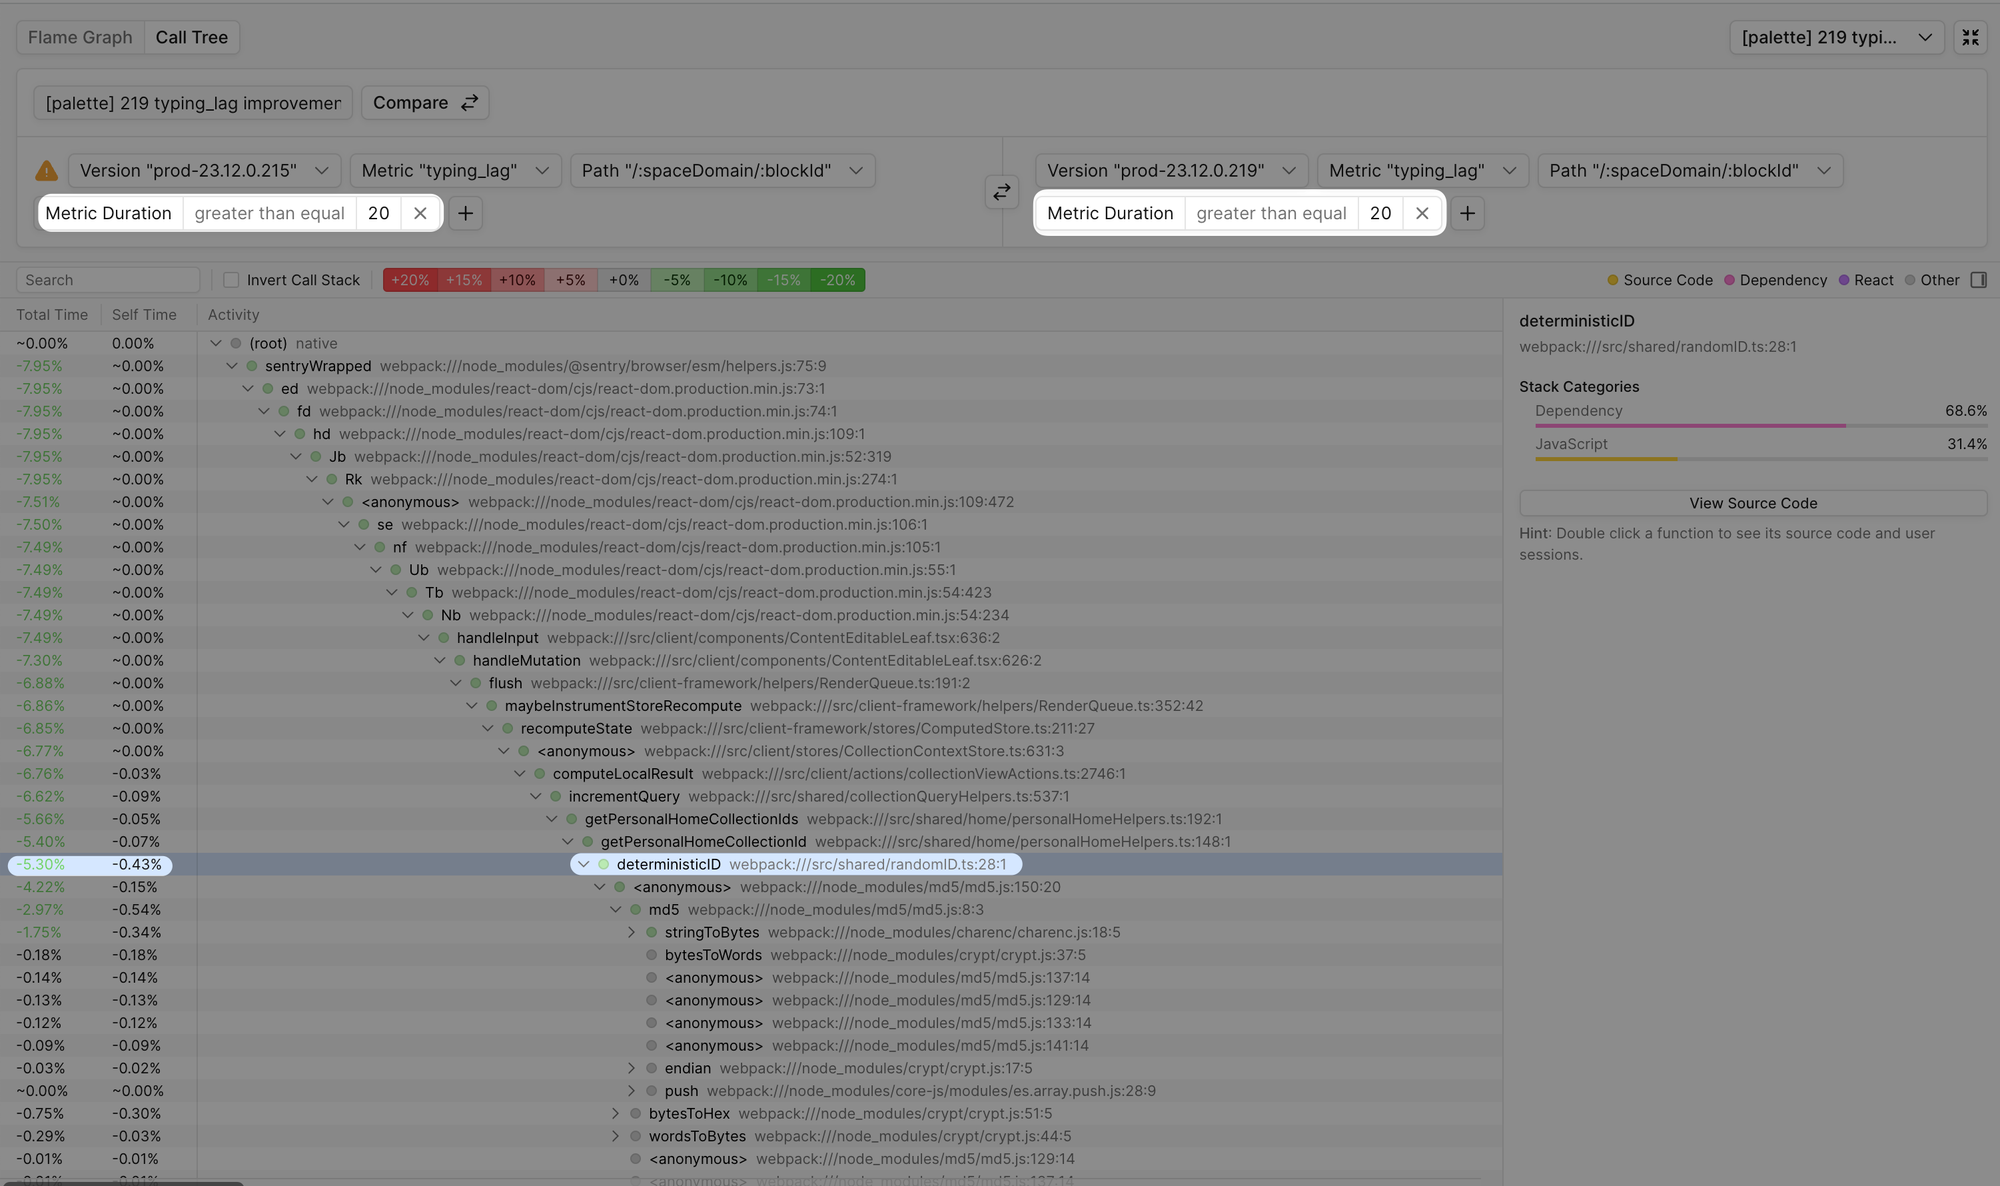
After reverting the changes to deterministicId, the team investigated the improvements to typing_lag using Profile Aggregates. As expected, it showed a reduction in total time for the deterministicId stack. When monitoring the p95, we saw an expectedly larger reduction of -5.30%.
Profile Aggregate for typing_lag:
Profile Aggregate for typing_lag p95 latency:
Identifying regressions to load latency
In addition to typing performance, load performance is crucial for delivering a responsive experience in Notion. Unfortunately, page load performance is difficult to maintain because it’s sensitive to refactors and initialization code introduced by new features.
The Notion team uses Palette to fix regressions to load latency. During one particular incident in January 2024, the team was investigating a 10% regression to the p50 of initial_page_render, their primary page load metric. By using Profile Aggregates’ Compare feature, the team identified the root cause of the regression was a code change that unexpectedly blocked page load. Below is the Profile Aggregate comparison for initial_page_render between the baseline and regressed versions:
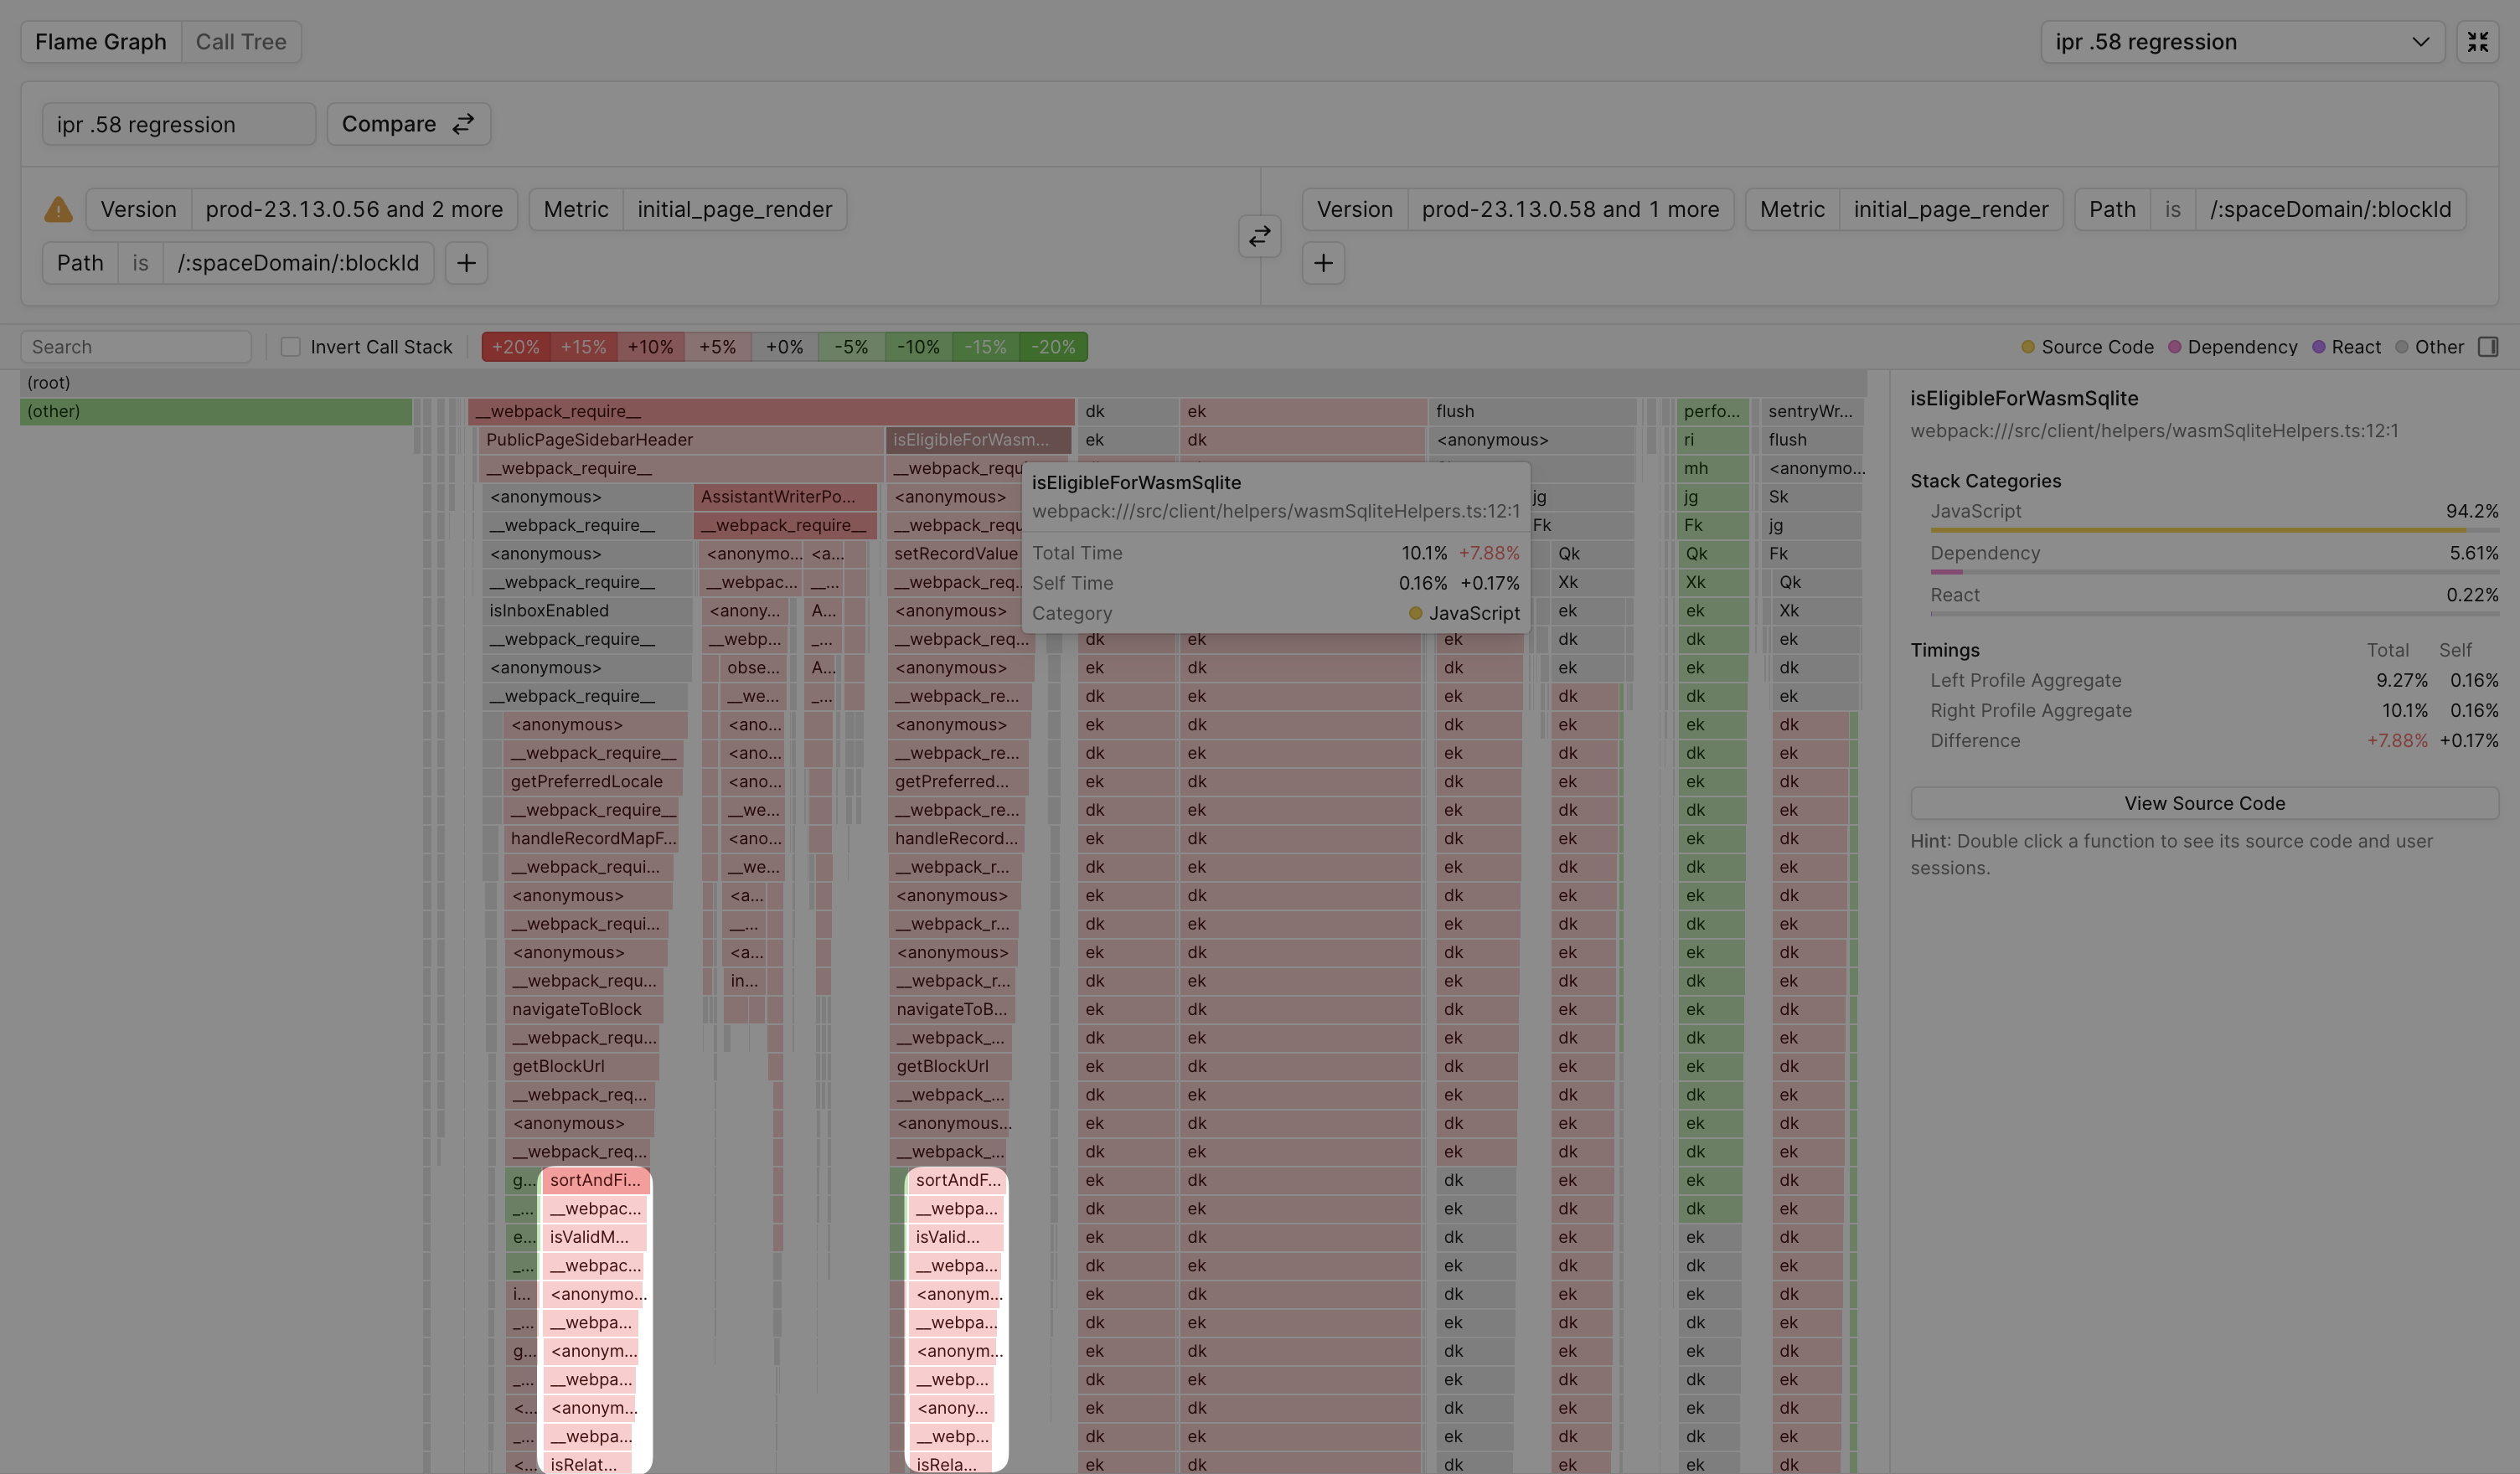
When inspecting the flame graph, the team saw an increase in total time for function stacks containing the function sortAndFind, highlighted above. They then realized this regression was attributed to a newly added feature, which unexpectedly initialized during page load. The function, sortAndFind, shown in red because it increased total time, was a function newly added function for this new feature. By deferring the feature’s initialization until after page load, the team saw the initial_page_render metric return to its baseline value.
Improving Notion table interaction responsiveness
Tables in Notion, officially referred to as Notion Databases, are one of the most interactive features of Notion. They allow users to build tables with rich types of content, including calendars, lists, and more. But when handling larger amounts of rows and columns, Notion Databases can become unresponsive.
When optimizing Notion Databases’ performance, we found Profile Aggregates weren’t actionable on their own because they contained too many code paths, making it difficult to isolate responsible code paths. To further our investigation, we needed a finer granularity into performance data than what Profile Aggregates offers.
We decided to leverage Palette’s User Sessions feature, which provides visibility into the metrics, traces, and profiles of individual user sessions, similar to Chrome DevTools. Doing so narrowed down the number of code paths responsible for impacting table interaction performance.
Profile Aggregates vs User Sessions
Homogenous vs Heterogenous Code Paths
When code execution is similar for a user interaction, we say its code paths are homogenous, and heterogenous otherwise. Scrolling in Notion would be an example of a homogenous interaction because the same code paths are usually run for all scroll events on the page. Keypresses in Notion are more heterogenous because their code paths fork depending on which key is pressed.


Heterogenous code paths are more difficult to optimize using Profile Aggregates.
Benefits of User Sessions
User Sessions visualizes performance data chronologically by showing a timeline of metrics, traces, and profiles that led to a specific slow user experience. This chronological sequence of events provides a different angle into performance data, making User Sessions more effective than Profile Aggregates for improving slow user experiences with heterogenous code paths.
Finding Relevant User Sessions
We decided to find user sessions with considerable amounts of Jank (ie. Long Tasks). By default, sessions are sorted by the sum of the metric value in a subset of a user’s session.
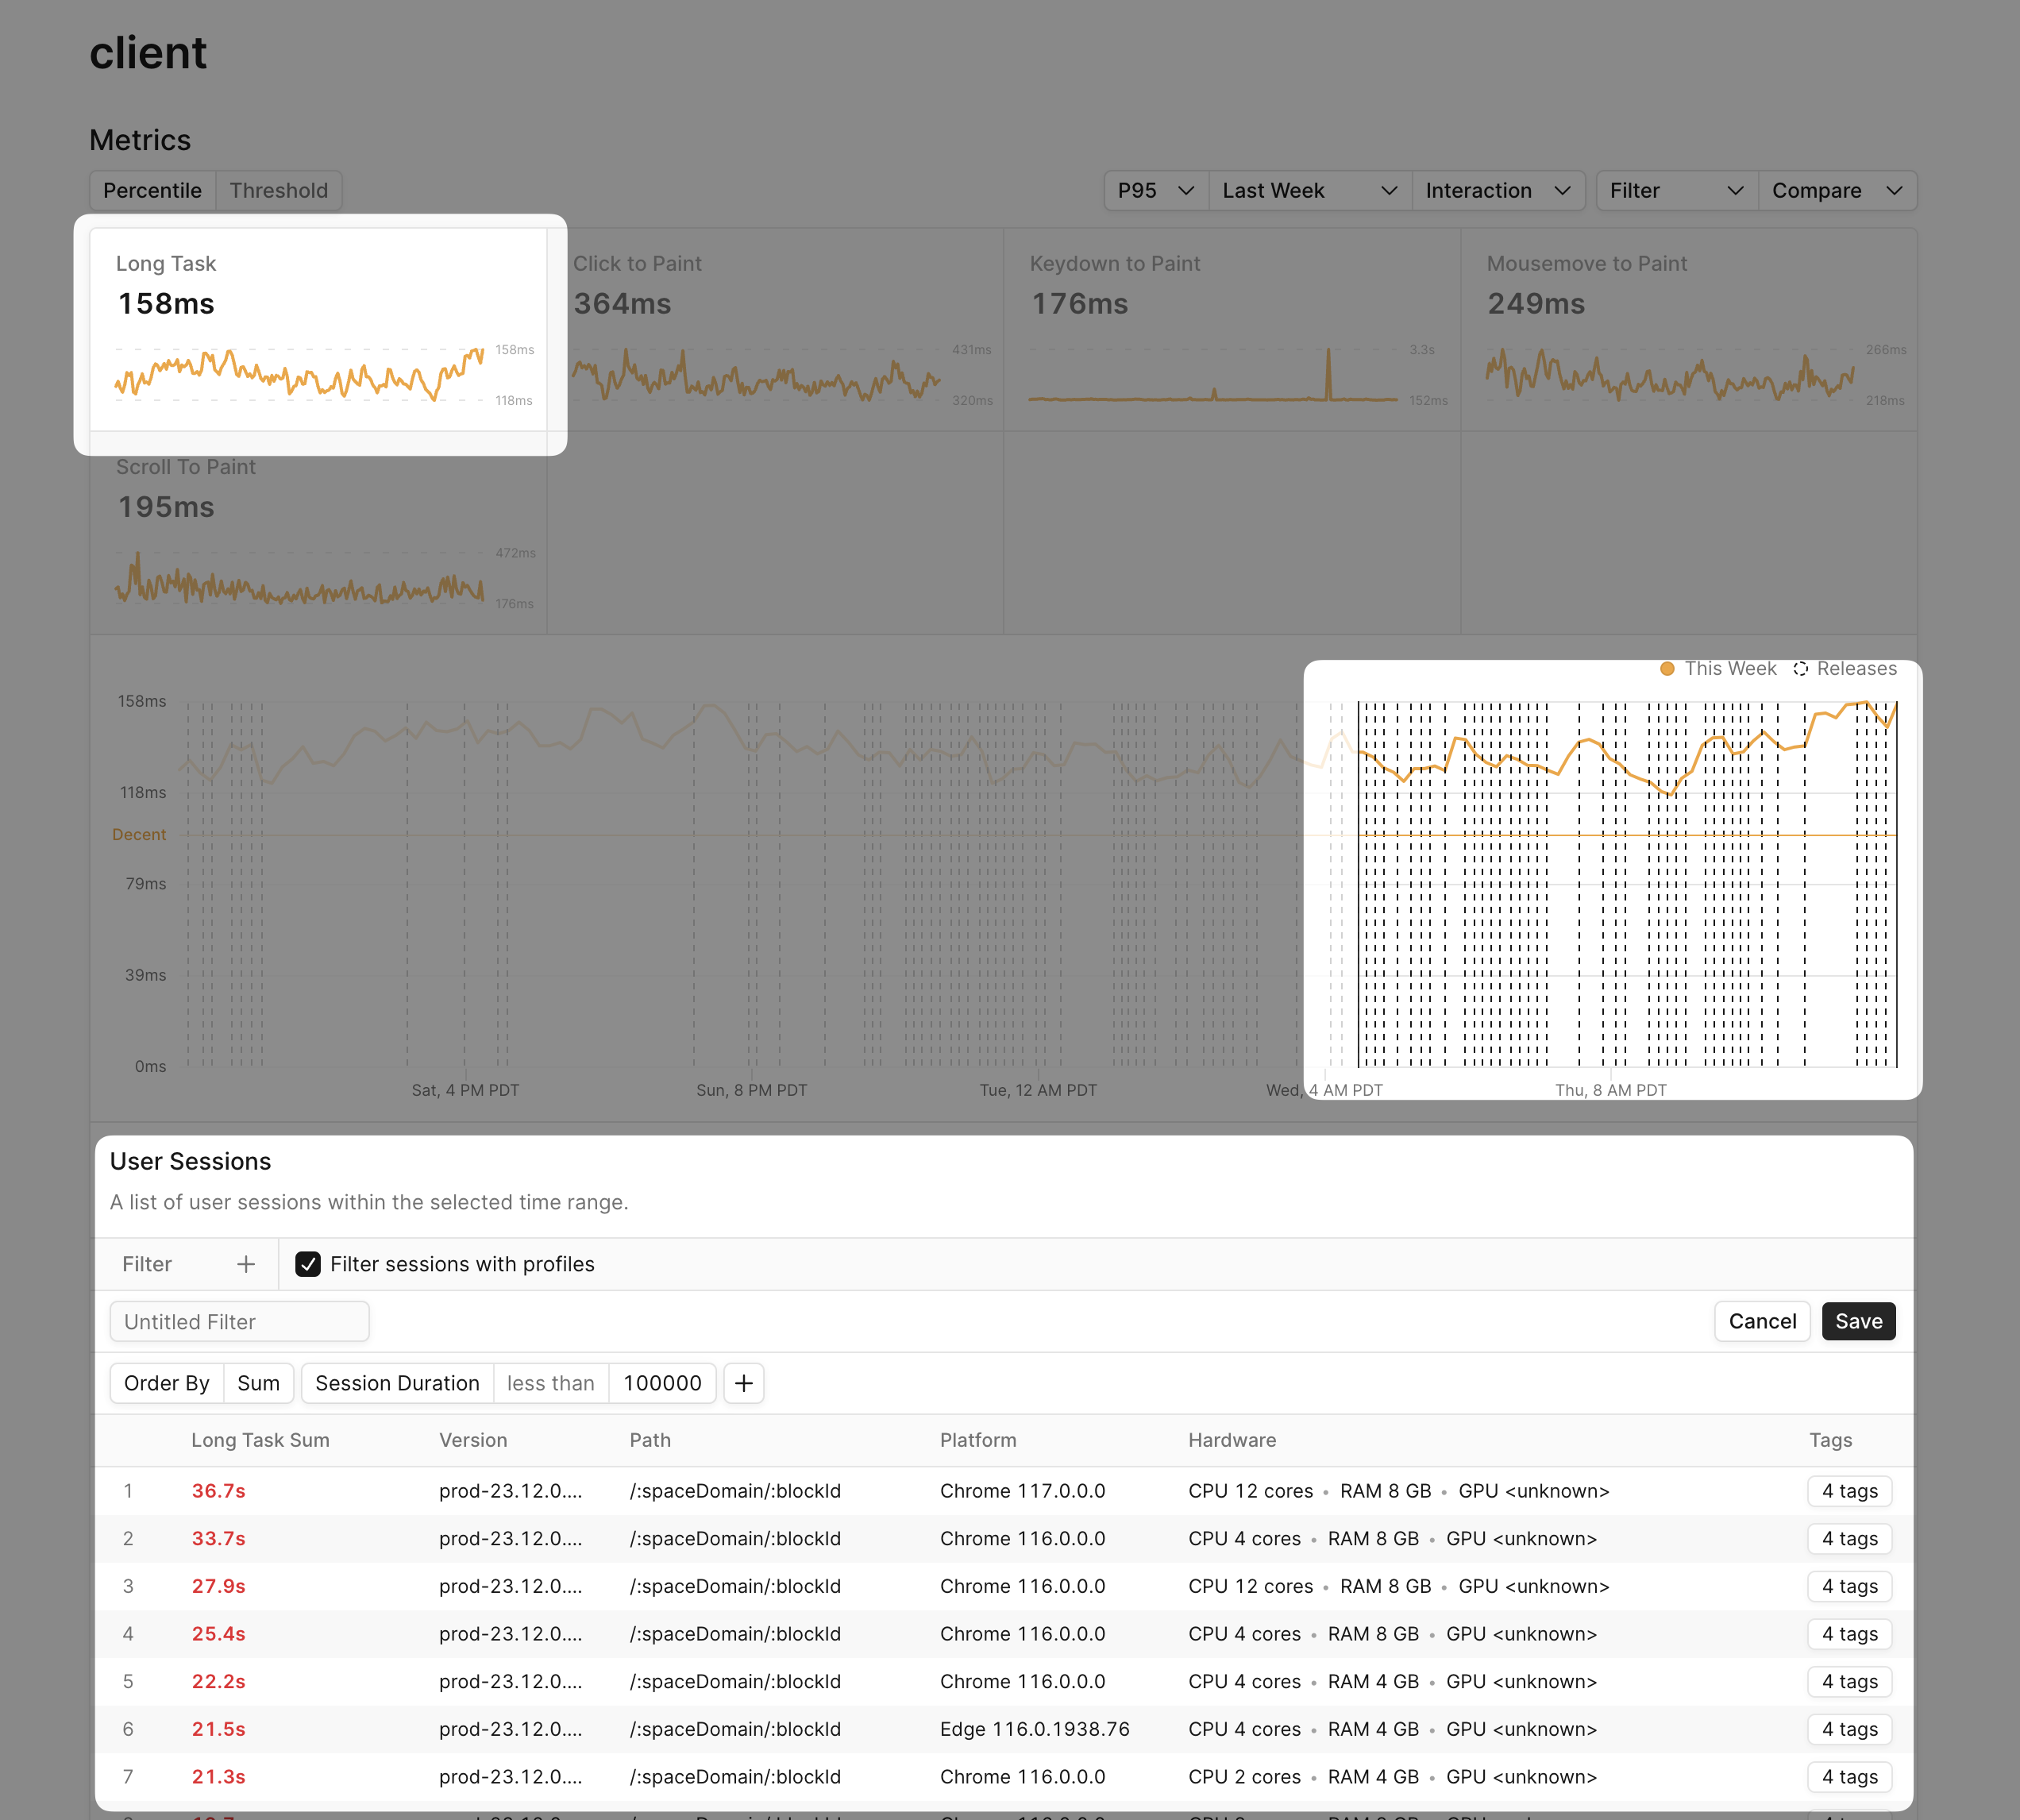
We began inspecting a few sessions and started noticing patterns between sessions.
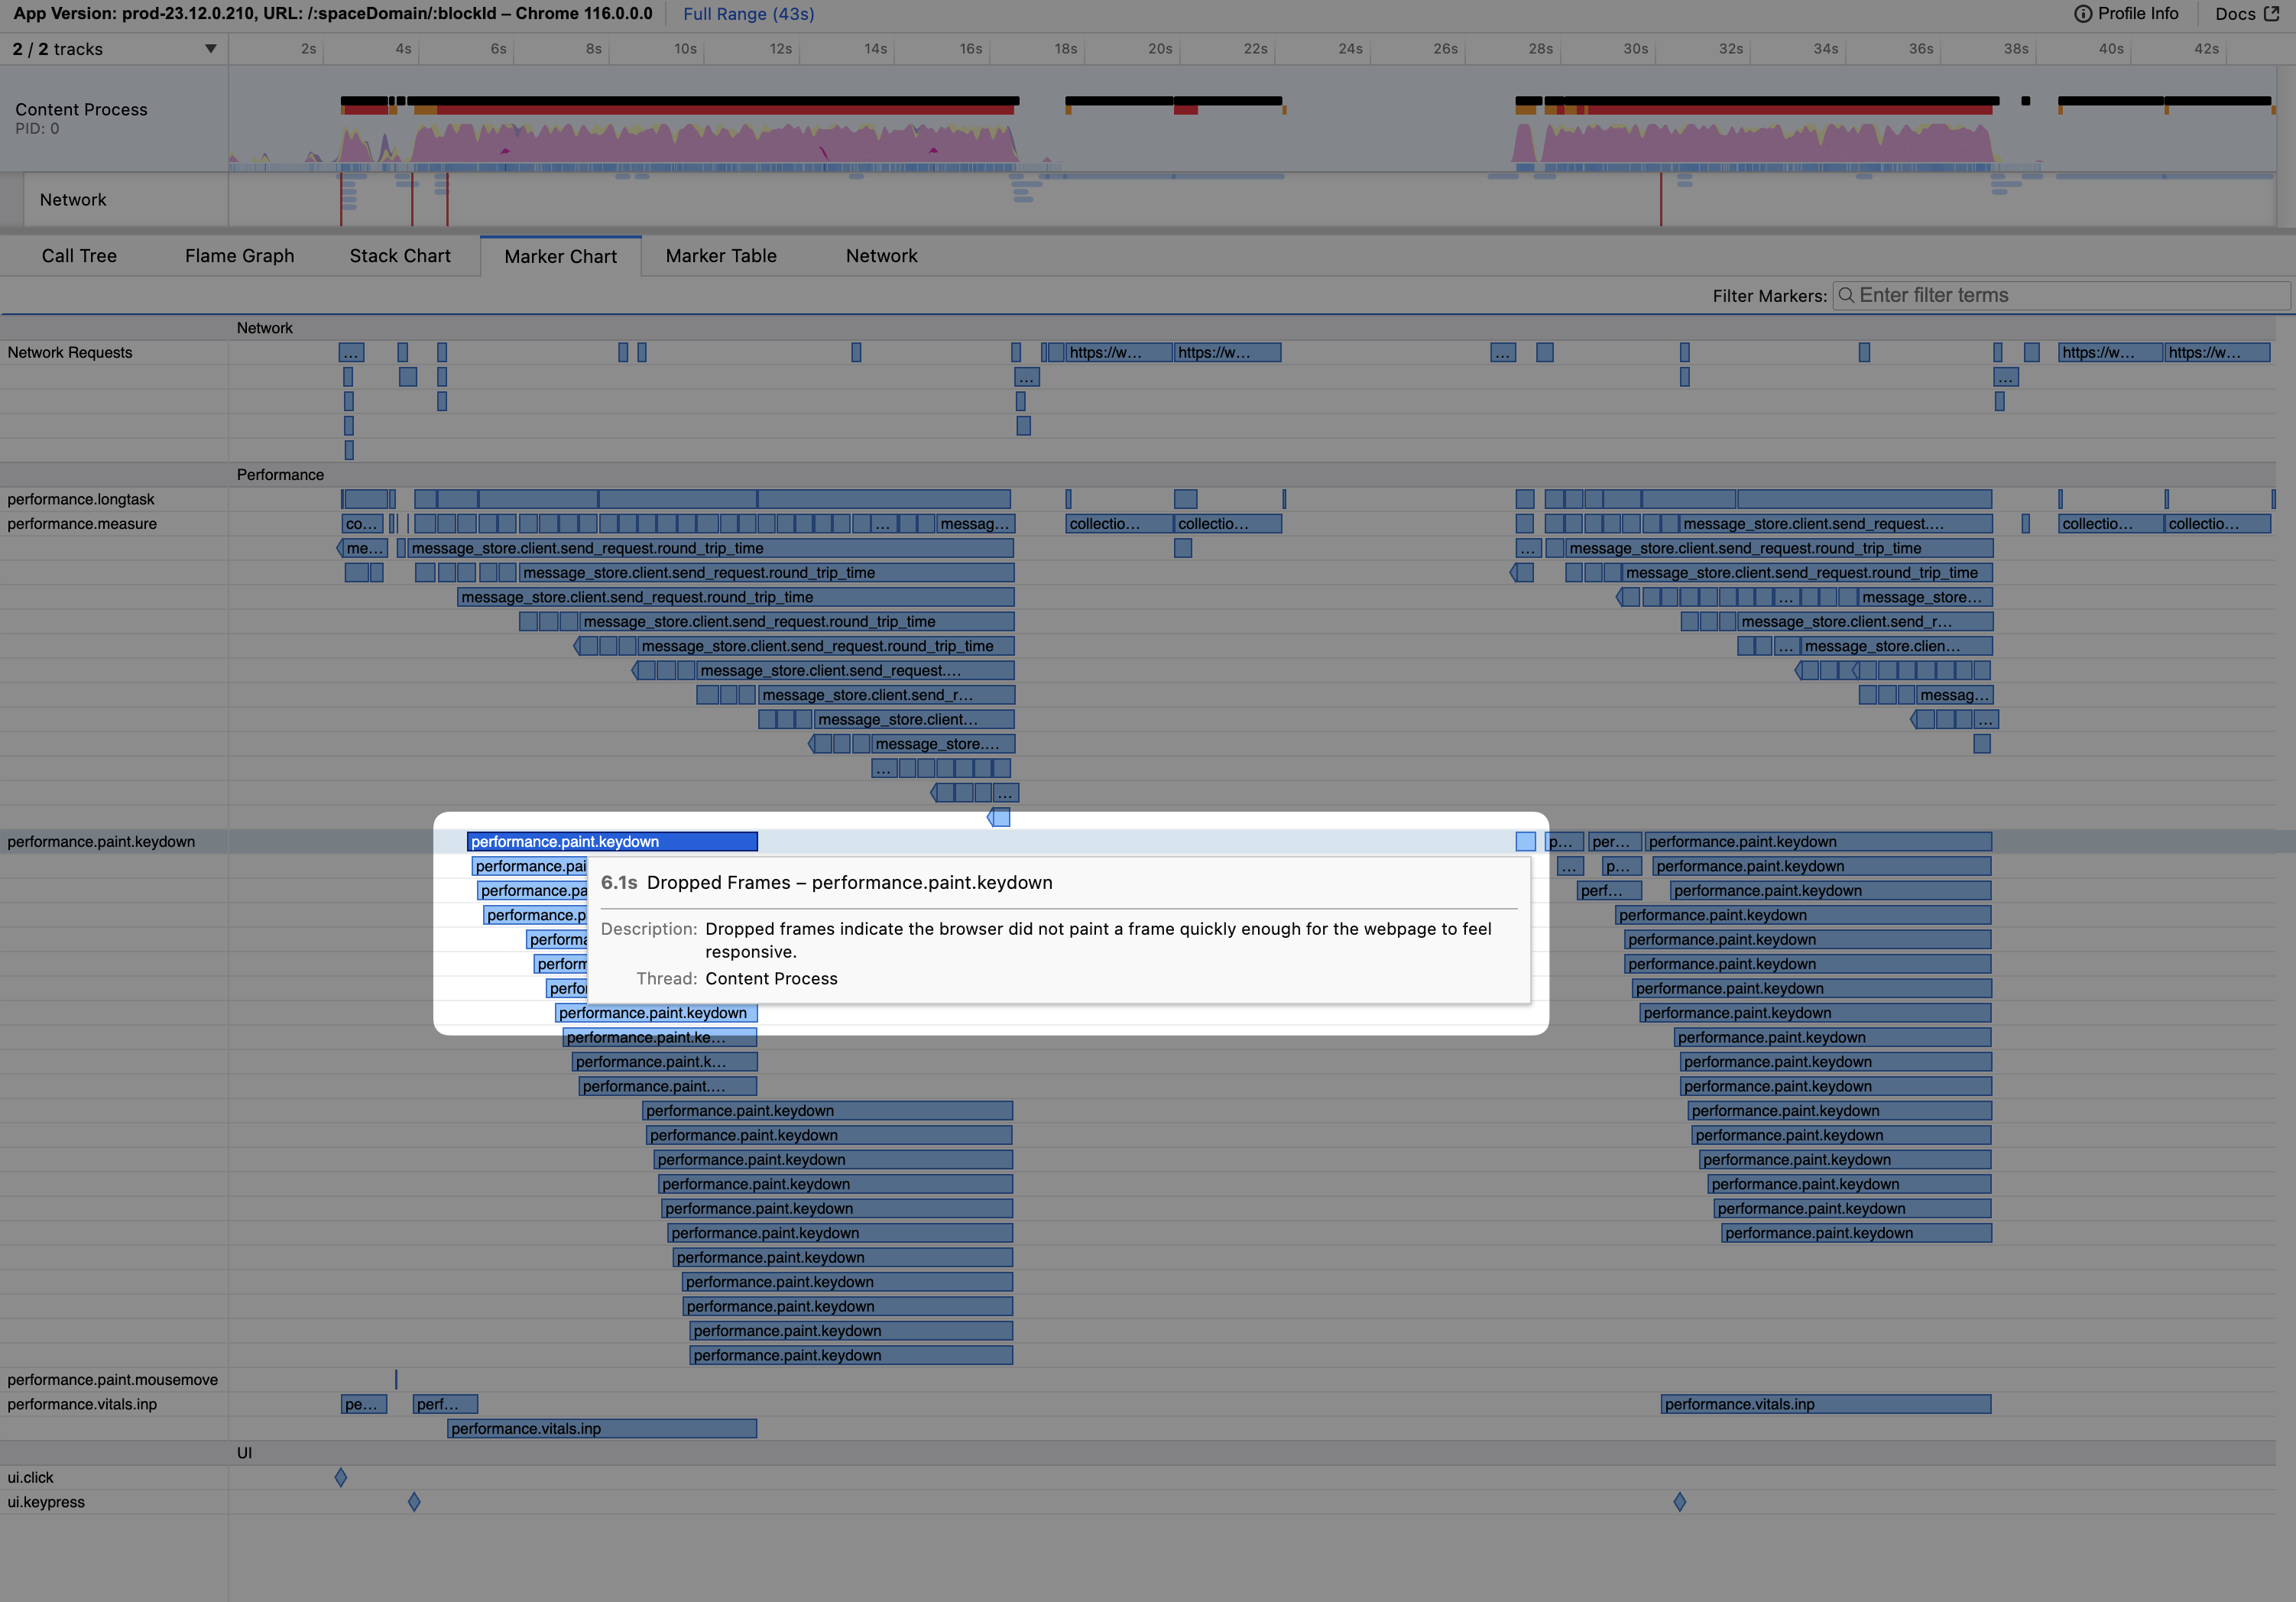
Dependencies unexpectedly blocking Keydown to Paint
After investigating a few sessions, we saw main thread blockage (Long Tasks) coincided with high KP latency. We then focused on function execution during these coinciding regions by inspecting the Call Tree, which summarizes function execution for a region of a user’s session:
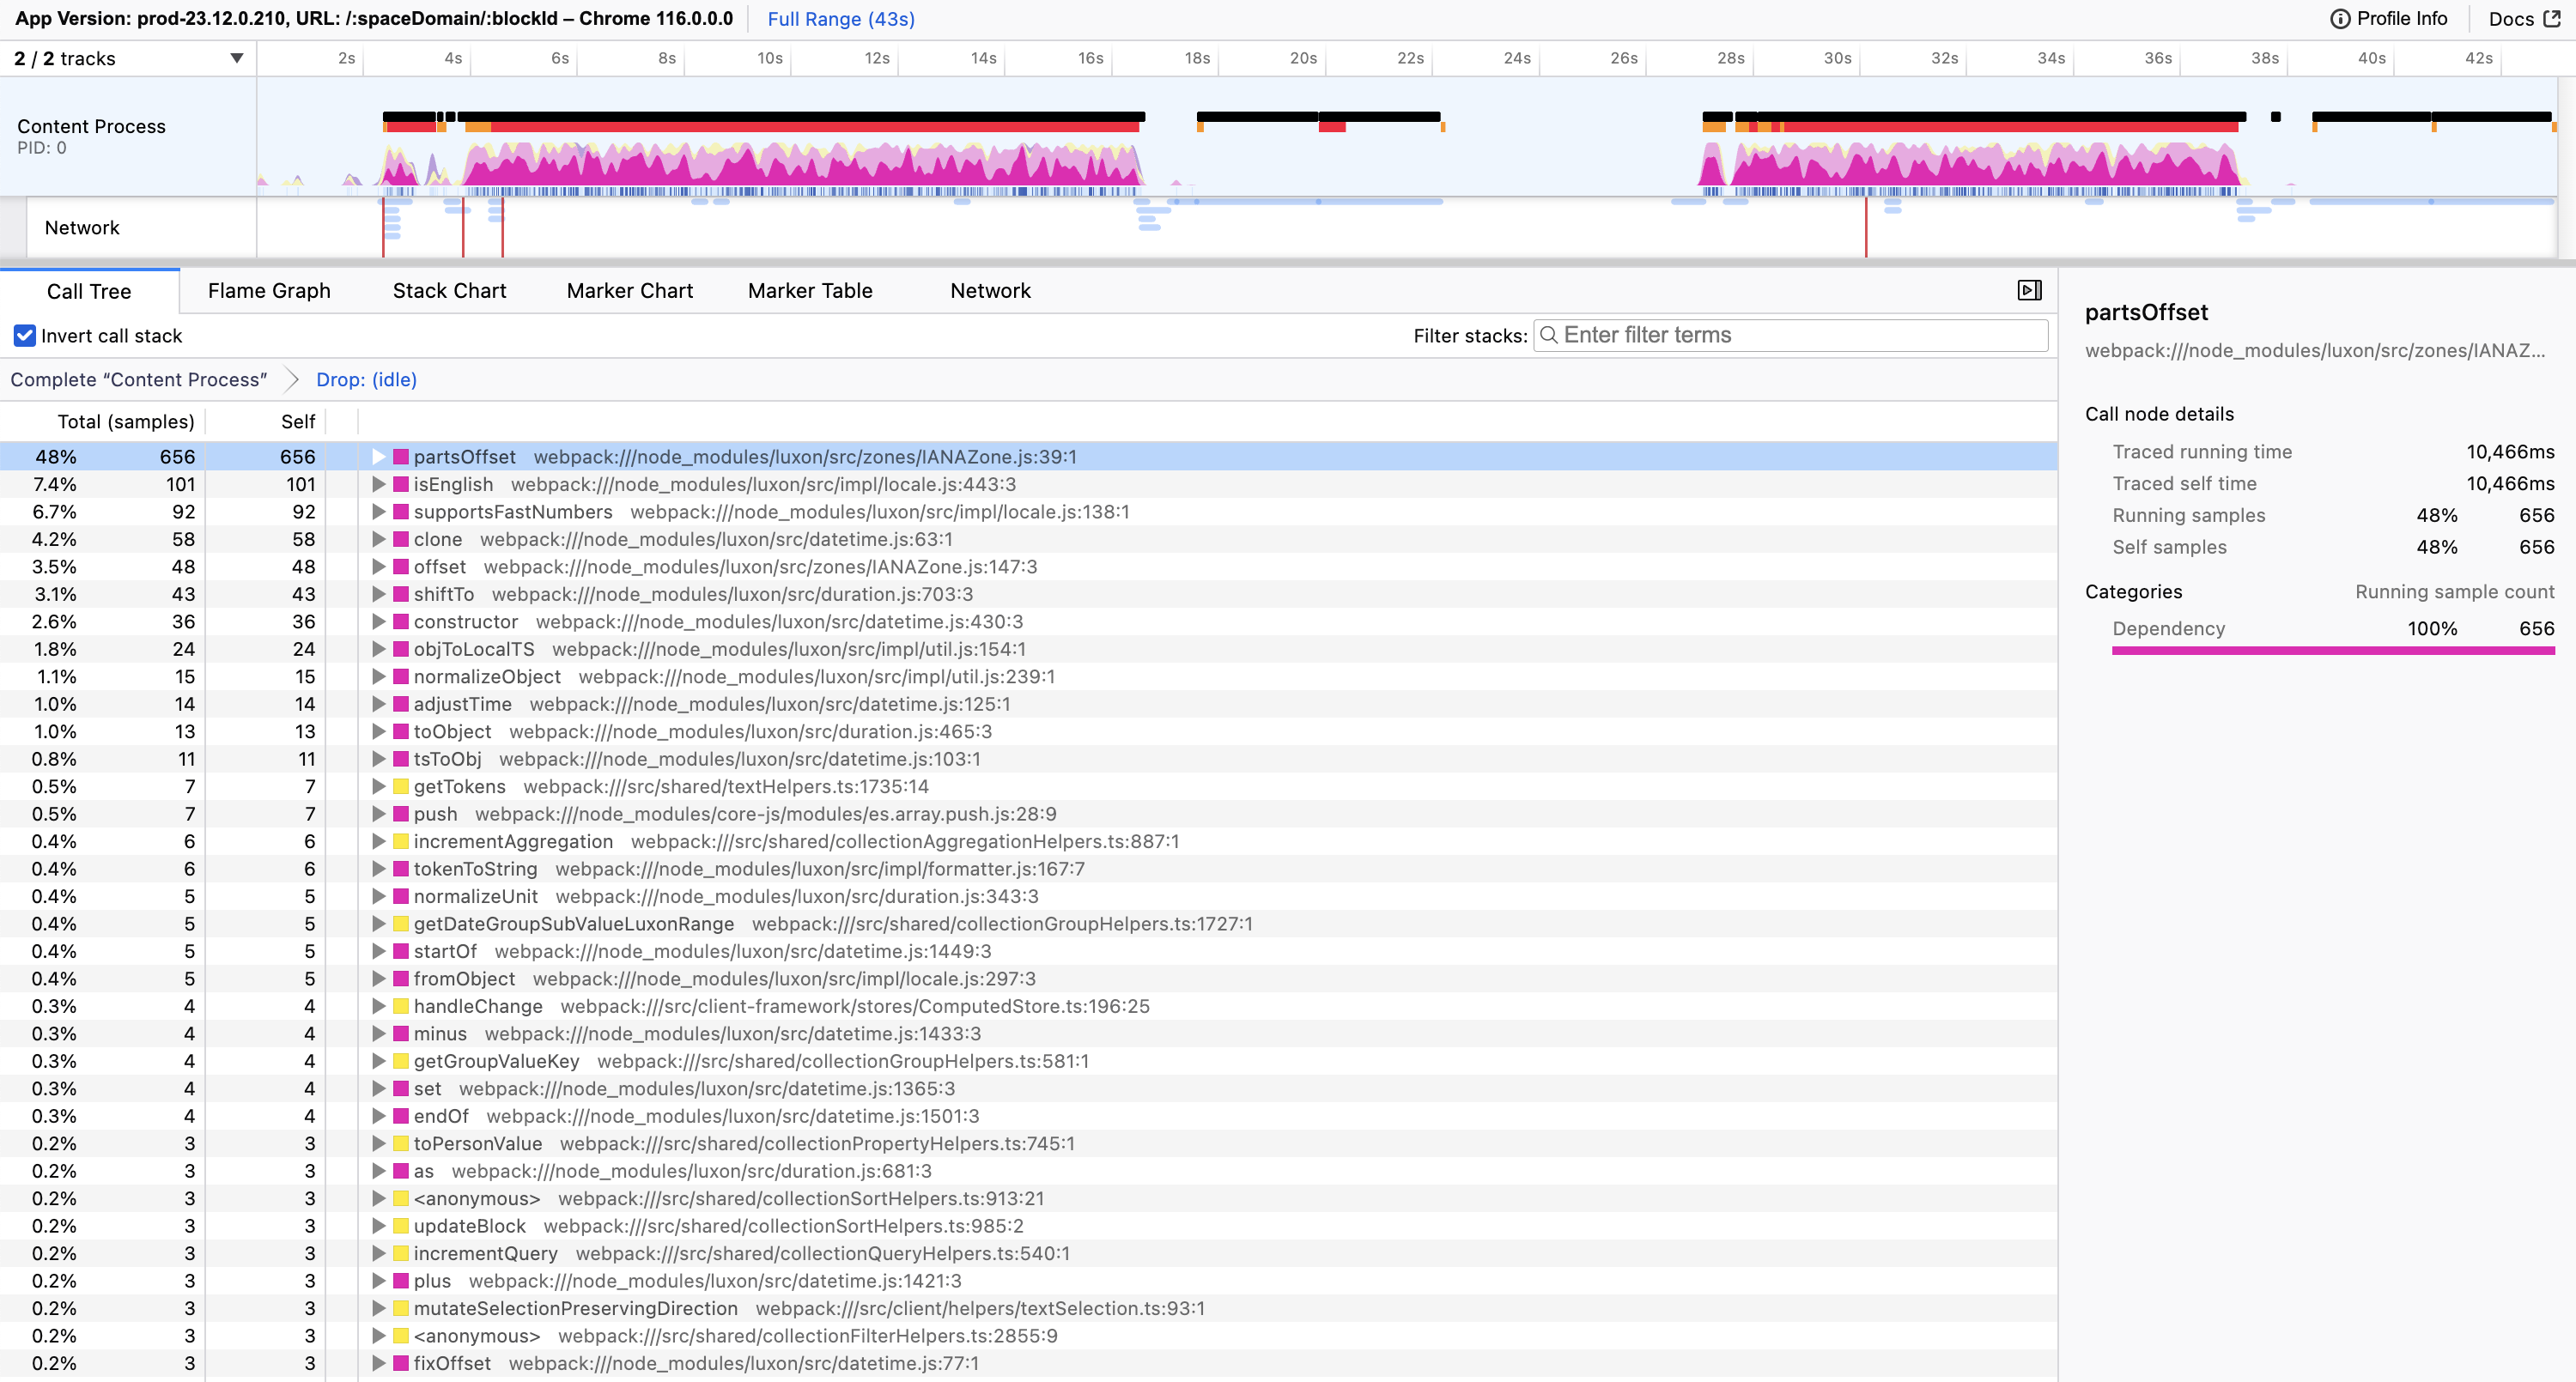
When inspecting each session, we saw the luxon dependency was frequently on top of the stack during these periods of Jank:
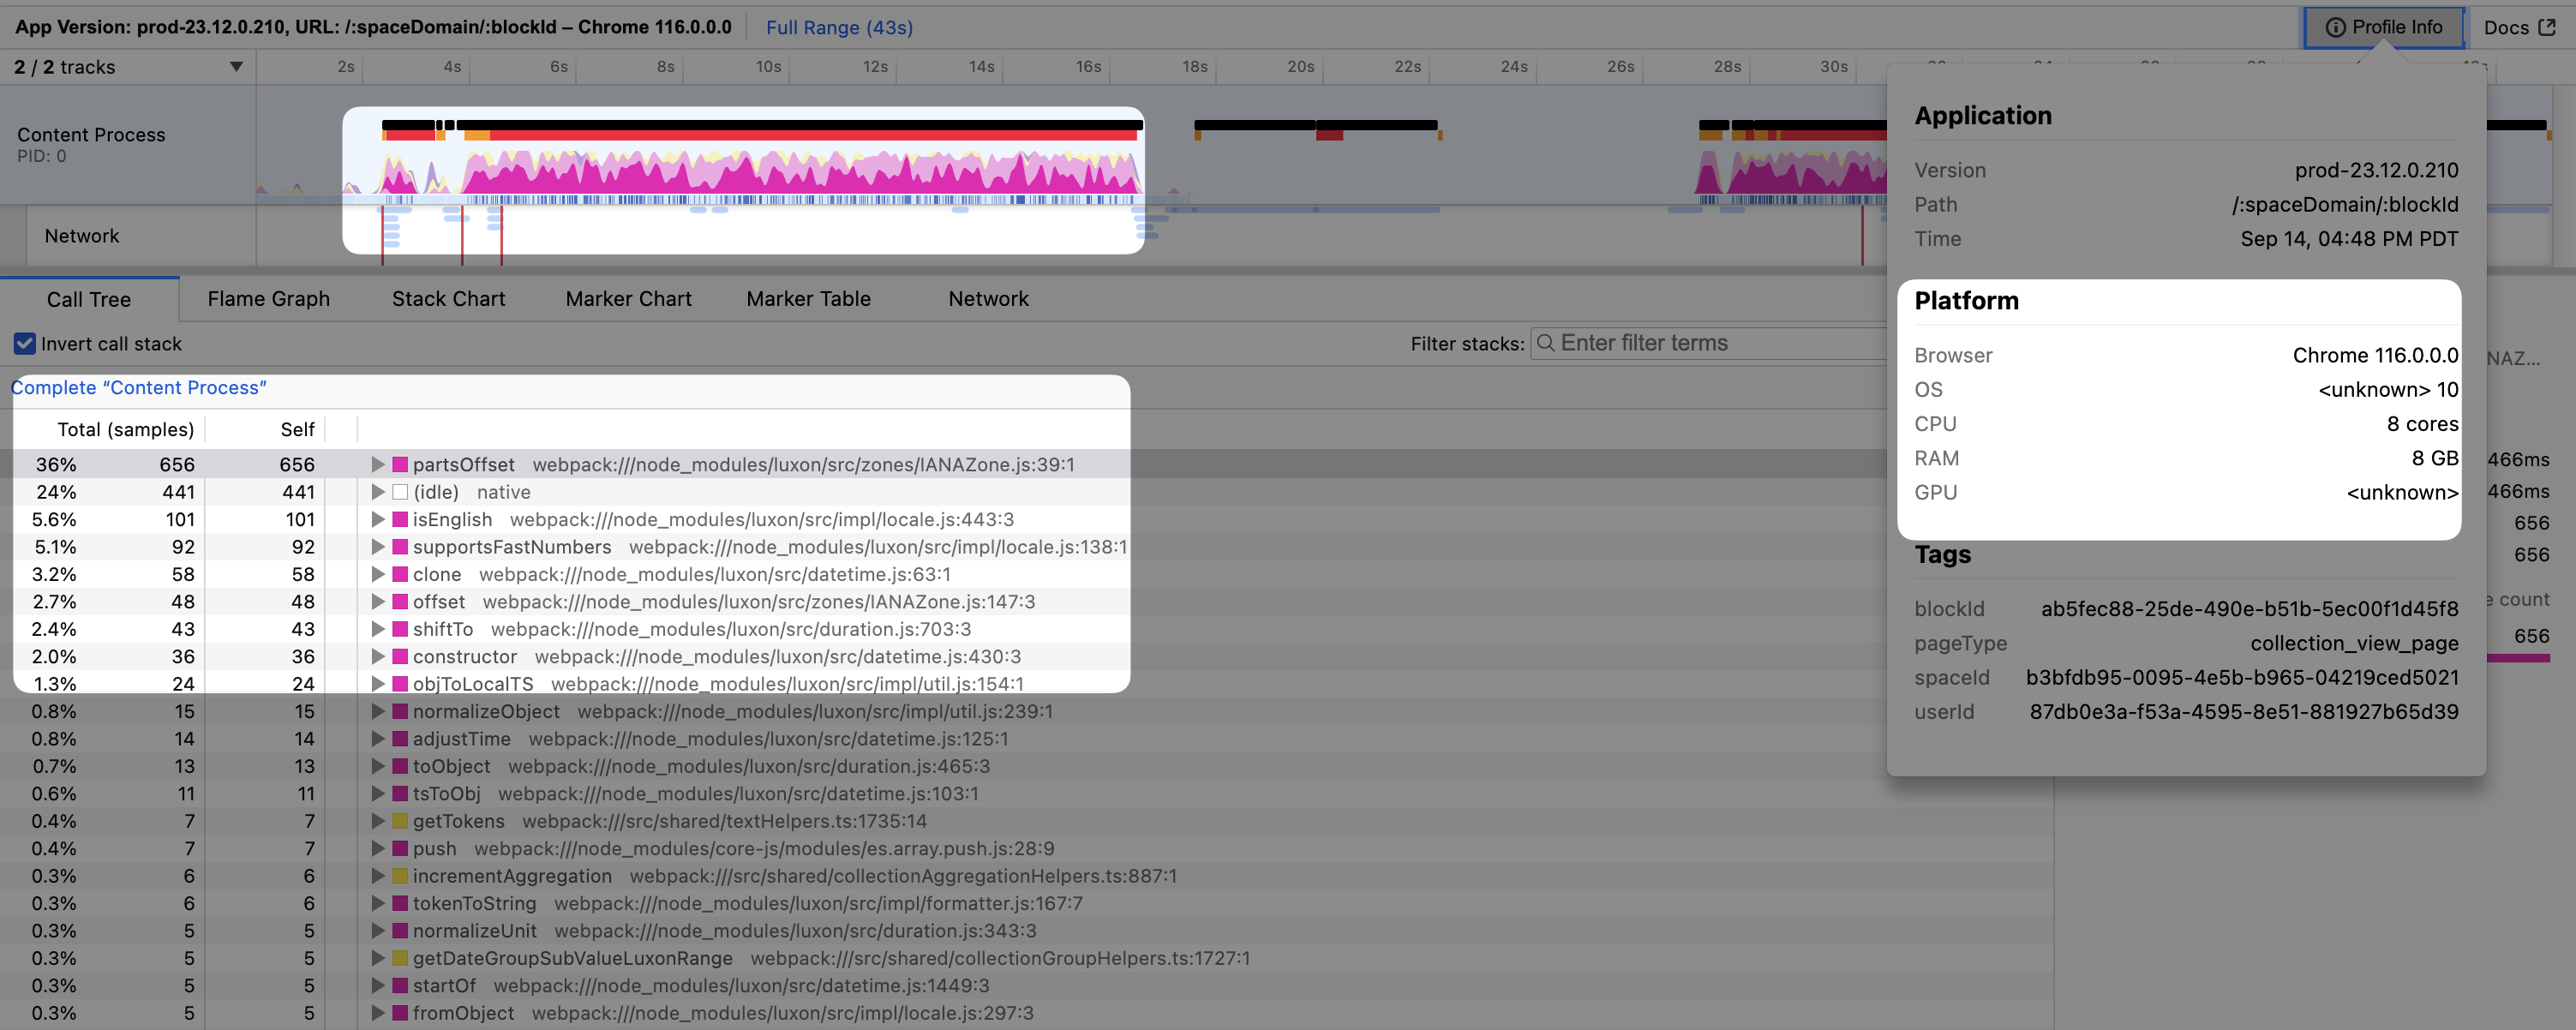
When inspecting the Stack Chart, which visualizes function execution chronologically, we see function execution is fairly homogenous. The work done seems relatively homogenous and blocks the stack for about 175ms:
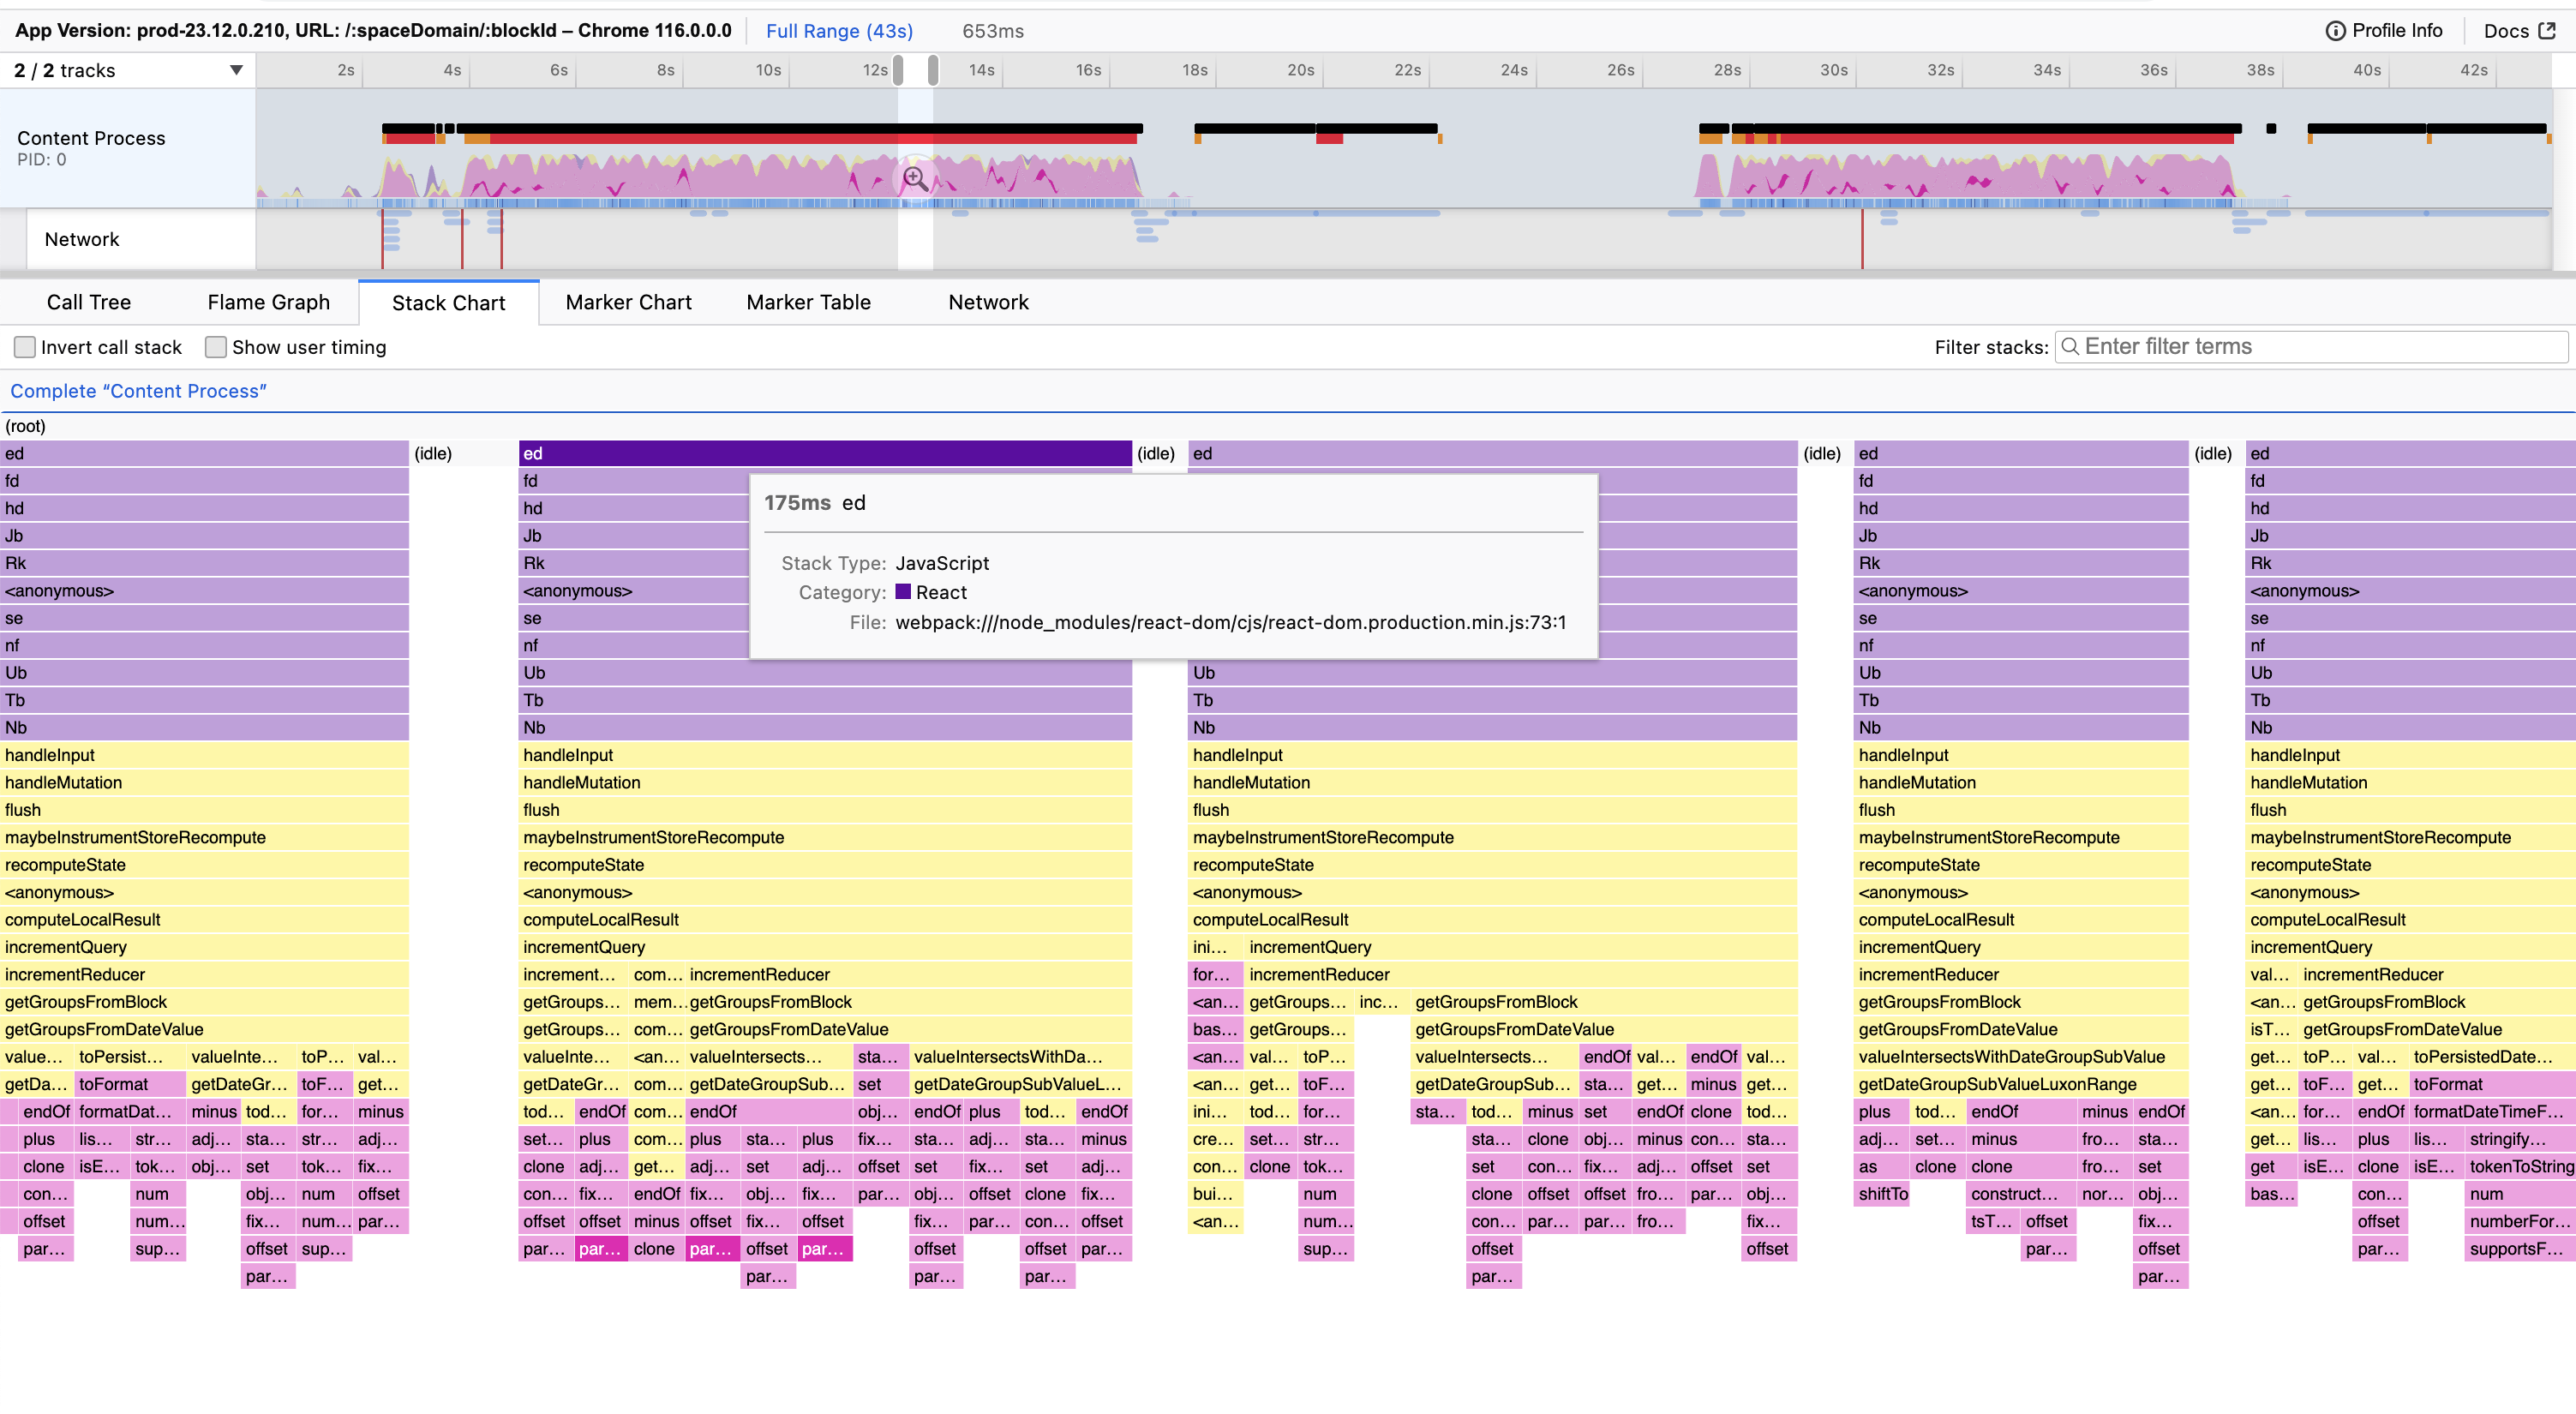
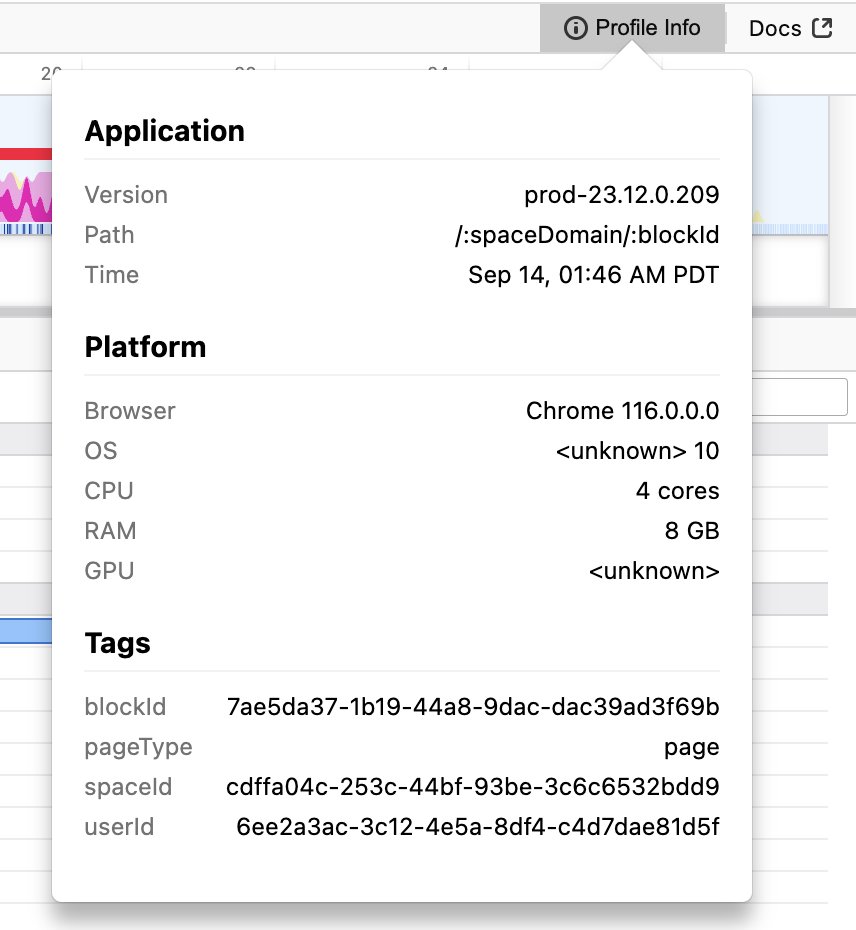
We suspect this user likely had lower device specs to have an experience that slow. We check the profile info tab and see the user has 4 hardware cores, which confirmed our hypothesis.
When reviewing similar user sessions, we found similar patterns with the luxon dependency. The pattern recurs in another user session below:
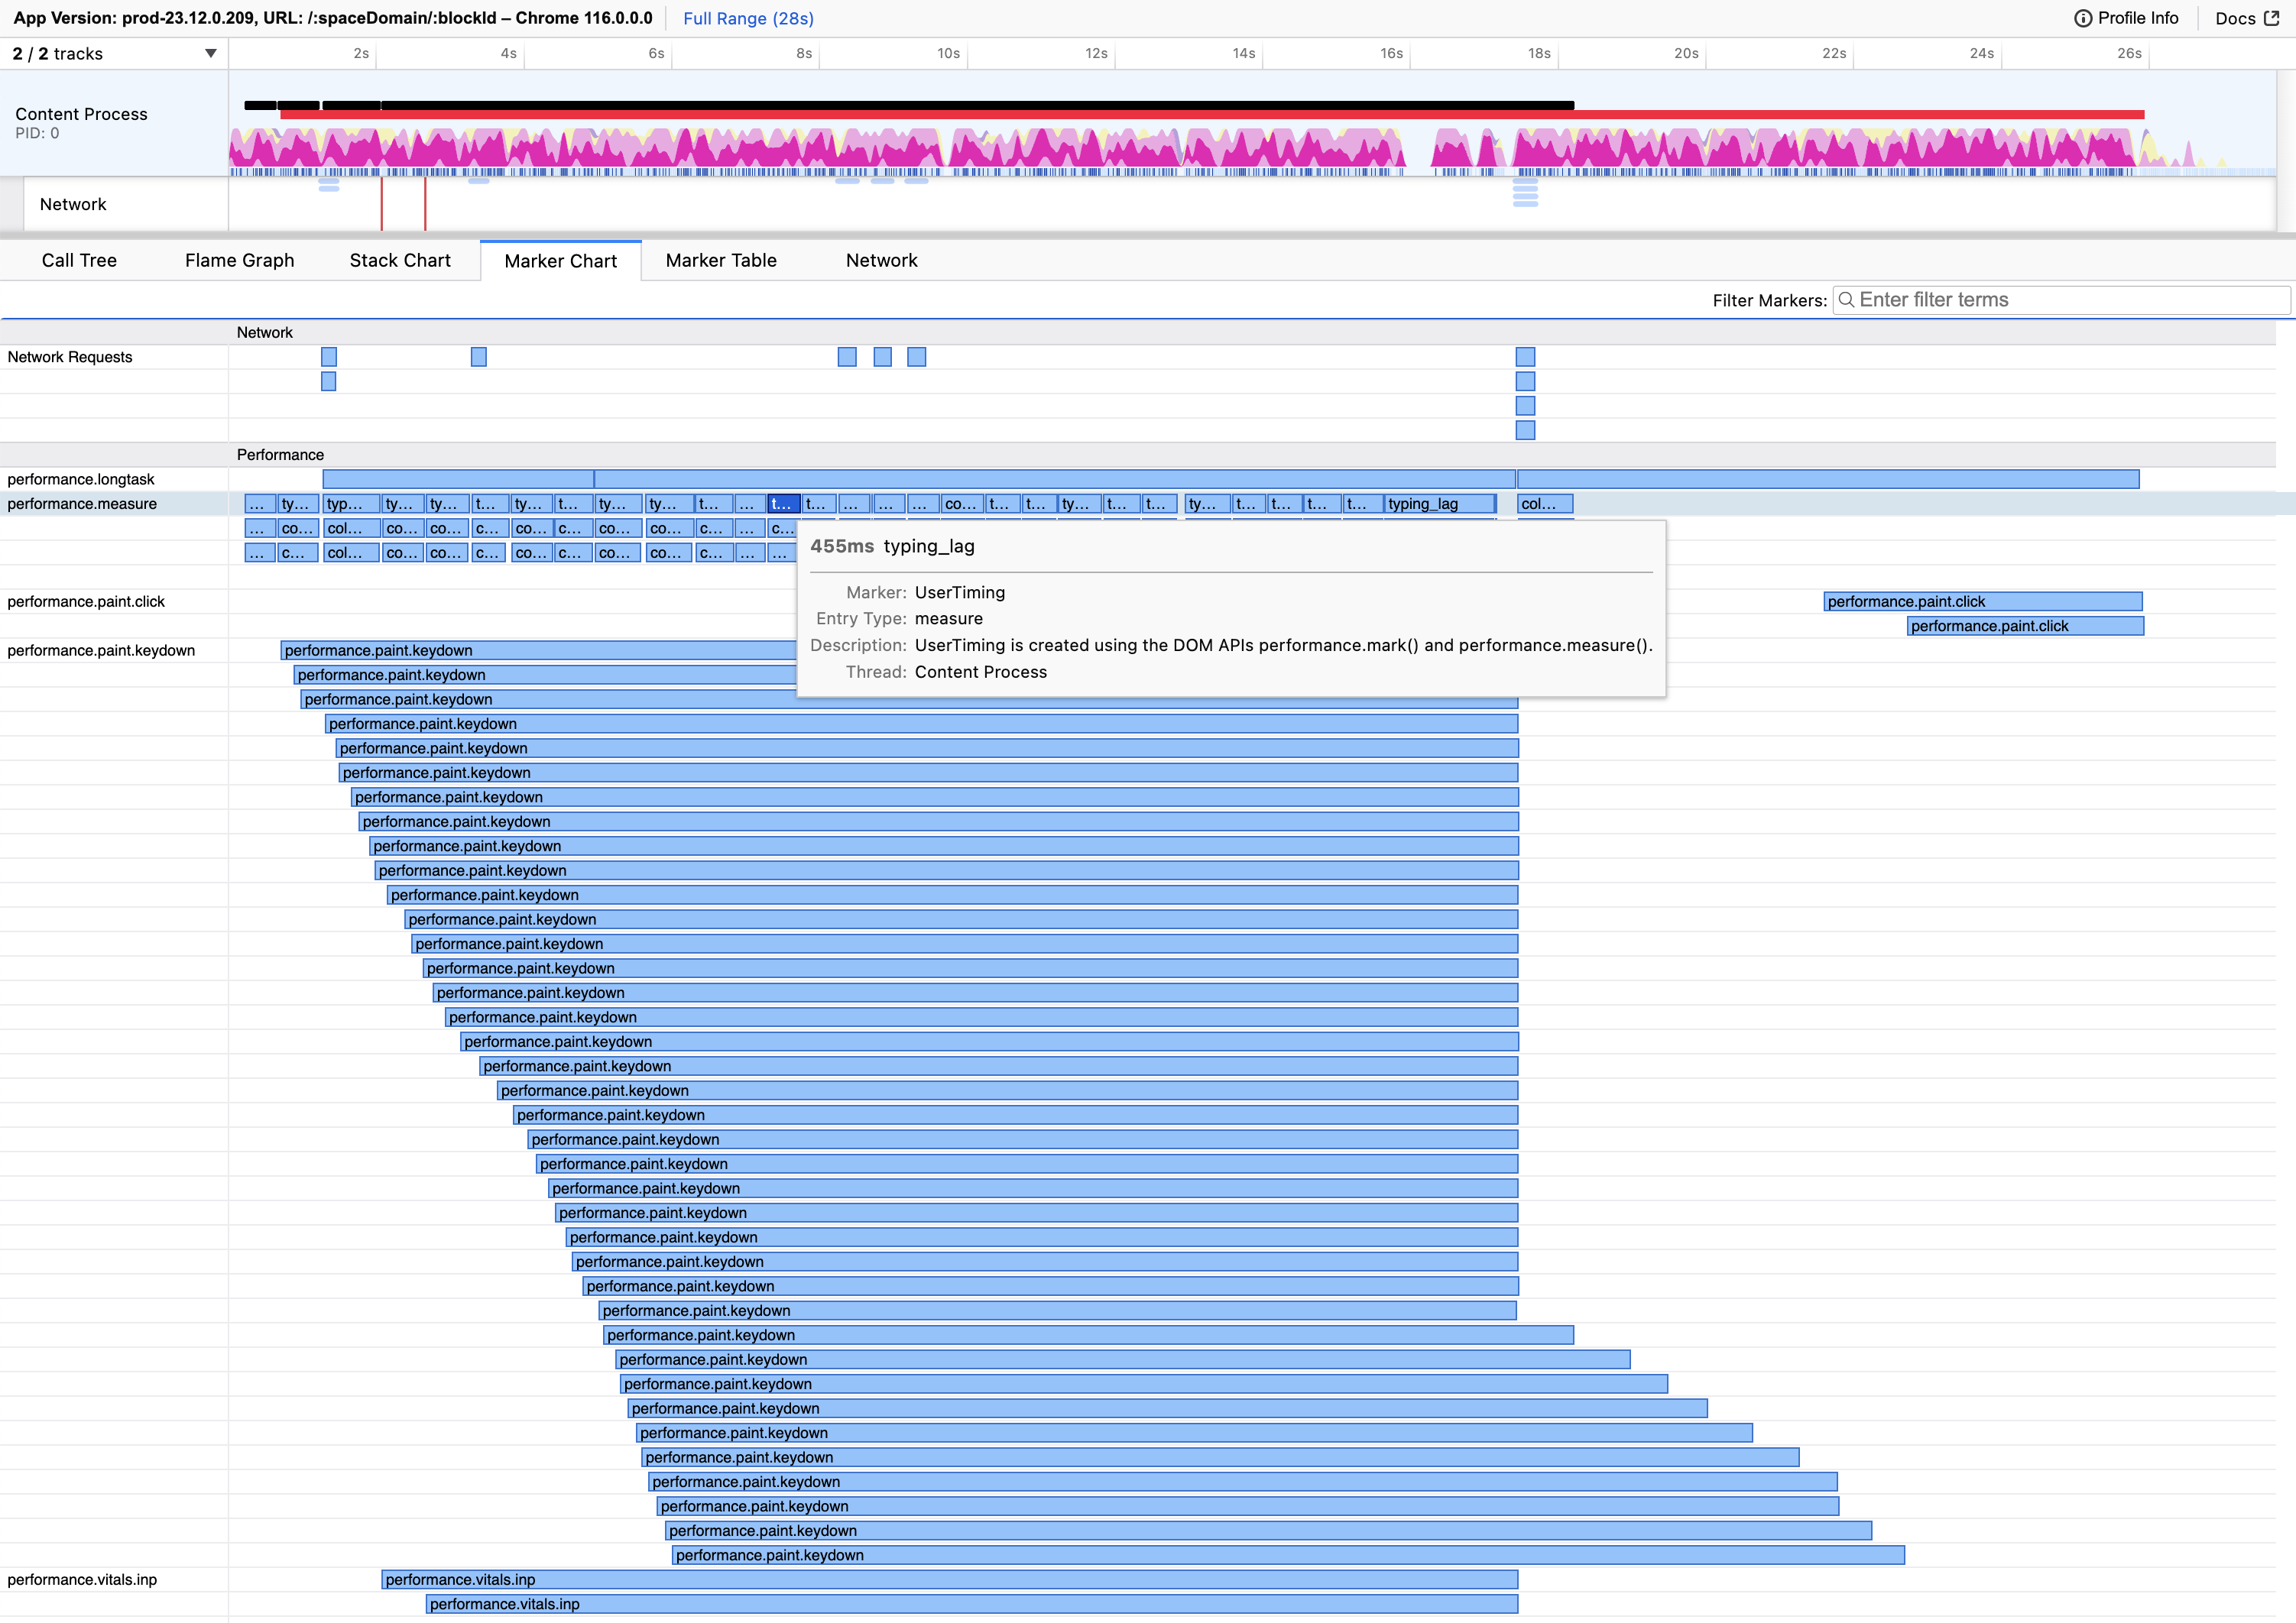
From this User Session, we see the following:
- Keydown to Paint latency of ~19s
- Coinciding and consecutive main thread blockage of ~26s
- Luxon dependency, shown in pink above, consistently accounting for most total time
User Sessions conclusively showed the luxon dependency was impacting KP and Long Tasks.
A Faster Notion
Building a fast text editing experience in the browser, while challenging, is possible with the right insight. Palette’s code-level visibility, both at the aggregate and individual user session level, helps Notion deliver a delightful experience to their users.
After integrating Palette, Notion was able to reduce load time by 15-20% and typing latency by 15%. Since its initial adoption, the team continues to use Palette to improve and maintain Notion’s performance.
At Palette, we think there’s many other web apps like Notion that strive to deliver delightful user experiences in the browser but find it challenging to do so. At Palette, our mission is to help — we want to enable developers to build responsive web apps that delight their users. We believe that building best-in-class performance tools for web developers is the way to make the web faster for everyone. If you’re interested in working with us, we’re hiring.
Q&A with Notion
Felix Rieseberg is an Engineering Manager at Notion. He is one of Electron's core maintainers and led the Desktop Infra team at Slack. He now leads the Web Infra team at Notion.
What value does Palette provide over other existing tools?
For reporting, we use mostly the same tools everyone else does. They’re almost interchangeable. We’re big fans of DataDog, Hex, Snowflake, and various other solutions that take all those numbers, aggregate them up, and then put them on the graph.
And the obvious next step is, if there's a major regression, someone will ask what happened. And that's where Palette comes in for us. I don't really have anything else other than Palette to take a look at that. Palette is really the one tool that we have that allows us to dig deeper into the root cause.
How does Local Profiling compare with Palette Profile Aggregates?
I think local profiling gets you pretty far. But the thing that local profiling doesn't give you is confidence. Field metrics will always be more accurate than what you see locally. Having an flame graph aggregated from end users is infinitely more valuable than having a flame graph collected on one machine. Palette is really the one tool that we have that allows us to dig a little deeper and be like “Okay, what could it have been”.
How is Palette valuable to engineering managers?
What Palette allows me do is remove some of that ambiguity, for instance, is it like mostly small changes that have a big outcome? Or is it a bunch of big changes that make everything 1% slower? Just answering that for me is tremendously powerful because it completely changes how I go about planning my limited resources — do I invest more in preventing the 30% performance increases. Or do I help engineers write faster code to go from 1% overhead to 0.1% overhead. That level of visibility is quite powerful for me.
I think Palette delivers a lot of value, not just to engineers, but also to engineering managers and the teams responsible for trying to figure out performance regressions. And the problem that I think we often have is one of attribution. “This went up. This went down”. The approach we took before was, look at all the pull requests in the release, guess which ones could have it could have been, and then essentially ask teams to prove to us that they didn't do it. This only works if you have some authority to even bump into a team and be like, drop everything you're doing and prove to us who didn't break things, which you don't always have, because sometimes other priorities are more important. And what Palette is really enabling here is to go much quicker from what happened to who done it.
How has Palette helped with performance regressions?
In performance incidents, the crime of the scene is rarely the root cause. That's a pretty common thing that happens. Someone changes some arbitrary code and, because Javascript is so interconnected and we have orchestration engines and data fetching engines, that change might actually lead to an increase in a completely different area. Being able to tie those things back together with profiling data is tremendously powerful.